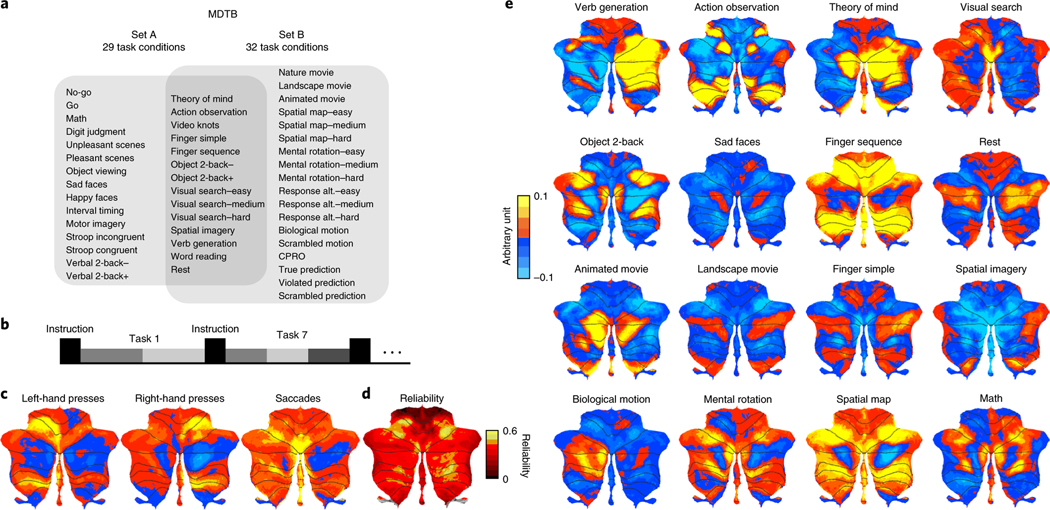
Fig. 1 |. MDtB.
a, Experimental design. A total of four fMRI scanning sessions were collected on the same set of participants using two tasks sets. Each set consisted of 17 tasks, with 8 tasks in common. The tasks were modeled as 29 task conditions in set A and as 32 in set B, with 14 task conditions common across both task sets. b, Timing of each task: 5 s instruction period followed by 30 s of task execution. Tasks consisted of a different number of task conditions (gray bars, range 1–3). c, Unthresholded, group-averaged motor feature maps, displayed on a surface-based representation of the cerebellar cortex14. d, Across-session reliability of activation patterns for each voxel. e, Group-averaged activation maps for selected tasks, corrected for motor features. The red-to-yellow colors indicate increases and the blue colors denote decreases in activation, relative to the mean activation across all conditions. Activity is normalized by the root-mean-square error of the time series fit for each voxel. CPRO, concrete permuted rules operations.

