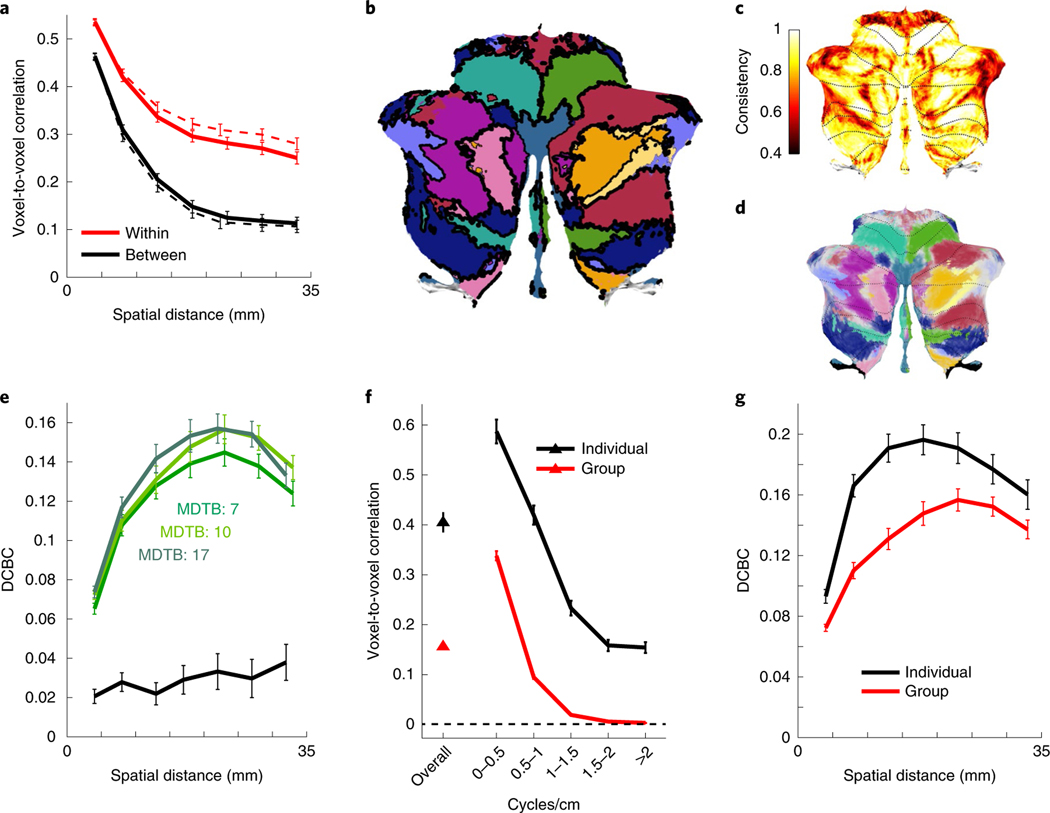
Fig. 3 |. MDtB parcellation reveals functional boundaries in the cerebellar cortex.
a, Average cross-validated correlations (see Methods) for ‘within’ (red) and ‘between’ (black) voxel pairs for MDTB parcellation (10 regions). The solid lines indicate the values for the cross-validated estimates; the dashed lines are the estimates for the full parcellation. b, Ten-region MDTB parcellation. The DCBC for each boundary is visualized by the thickness of the black lines. c, Proportion of samples in the bootstrapped analysis (participants) where the voxel was assigned to the same compartment as in the original parcellation. Most voxels had a consistency of assignment >0.6. d, Visualization of boundary uncertainty, using the color scheme in b, but adjusted so that the degree of transparency is indicative of the uncertainty of the assignment. Voxels that were assigned to a single compartment on less than 50% of the cases are shown in gray. e, DCBC as a function of the spatial distance for the lower bound of the three MDTB parcellations (colored lines) and lobular parcellation (black line). f, Within-subject (black) and between-subject (red) reliability of activation patterns overall and across different spatial frequencies. g, DCBC as a function of voxel distance for the ten-region group parcellation (red) and the average of the ten-region individual parcellations (black). Only the cross-validated estimates of the prediction performance for novel tasks are shown. In all panels, the error bars show the between-participant s.e.m. for n = 24 participants.

