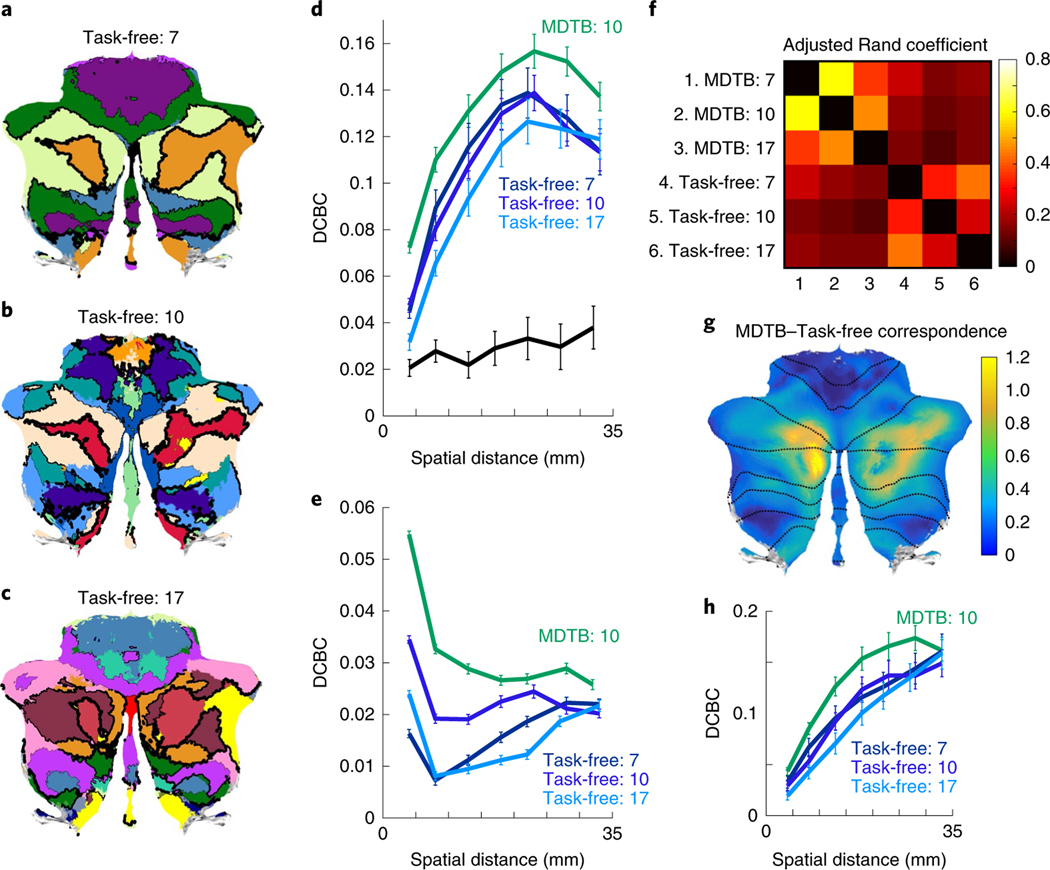
Fig. 4 |. Comparison of MDtB and task-free parcellations of the cerebellum.
a–c, Cerebellar parcellations based on task-free data with 7, 10 and 17 regions6. Thickness of the black lines indicates the DCBC for the corresponding boundary. d, DCBC for different spatial distances for lobular (black), task-free (dark and light blue) and MDTB (green) parcellations. MDTB parcellation was evaluated in a cross-validated fashion (see text). e, Evaluation of the same parcellations on task-based data from 186 HCP participants. f, Matrix of adjusted Rand coefficients between three versions of the MDTB parcellations (7, 10, 17) and the three task-free parcellations (7, 10, 17). g, Correspondence between MDTB and task-free parcellations. A value of 1 (yellow-green) indicates that the adjusted Rand coefficient between task-free and MDTB parcellations is the same size as the adjusted Rand coefficient between MDTB parcellations. Lower values (blue-green) indicate weaker agreement between task-free and MDTB parcellations compared to MDTB on its own. h, Evaluation of MDTB parcellation (derived only from set A) and the task-free parcellations on the three movie tasks from set B. d,e,h, The error bars show the between-participant s.e.m. for n = 24 or n = 186 (e) participants.

