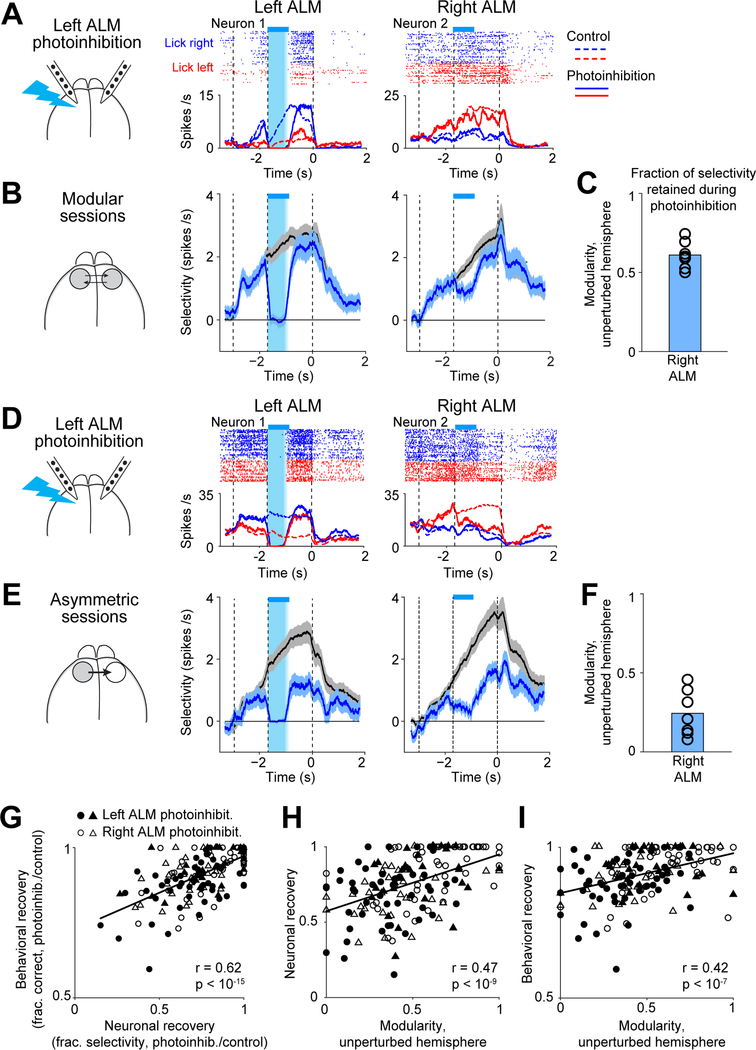
Figure 4. Modular organization predicts robustness to perturbations.
(A) Two neurons from an example modular session. Spike raster and PSTHs, left ALM photoinhibition trials (solid lines). Control trials PSTHs (dashed lines). Cyan bars, photoinhibition period.
(B) Selectivity of 7 modular sessions with the highest modularity in both the left and right ALM. Black, control trials; cyan, left ALM photoinhibition. Mean ± s.e.m. across neurons. Left ALM, 195 neurons; right ALM, 202.
(C) Modularity of the right ALM for sessions in (B). Bar, mean; circles, individual sessions.
(D) Two neurons from an example asymmetric session.
(E) Selectivity of 7 asymmetric sessions with the largest difference in modularity between the two hemispheres. Left ALM, 226 neurons; right ALM, 212.
(F) Same as (C) but for asymmetric sessions.
(G) Neuronal recovery versus behavioral recovery. Neuronal recovery, fraction of selectivity recovered at the end of the delay epoch (Methods). Behavioral recovery, performance after photoinhibition relative to control trial performance. Circles, sessions from the standard task (n=49); triangle, fully reversed task (n=30). Filled symbols, left ALM photoinhibition; open symbols, right ALM photoinhibition. Line, linear regression and Pearson’s correlation.
(H) Neuronal recovery versus modularity of the unperturbed hemisphere.
(I) Behavioral recovery versus modularity of the unperturbed hemisphere.
See also Figure S5.

