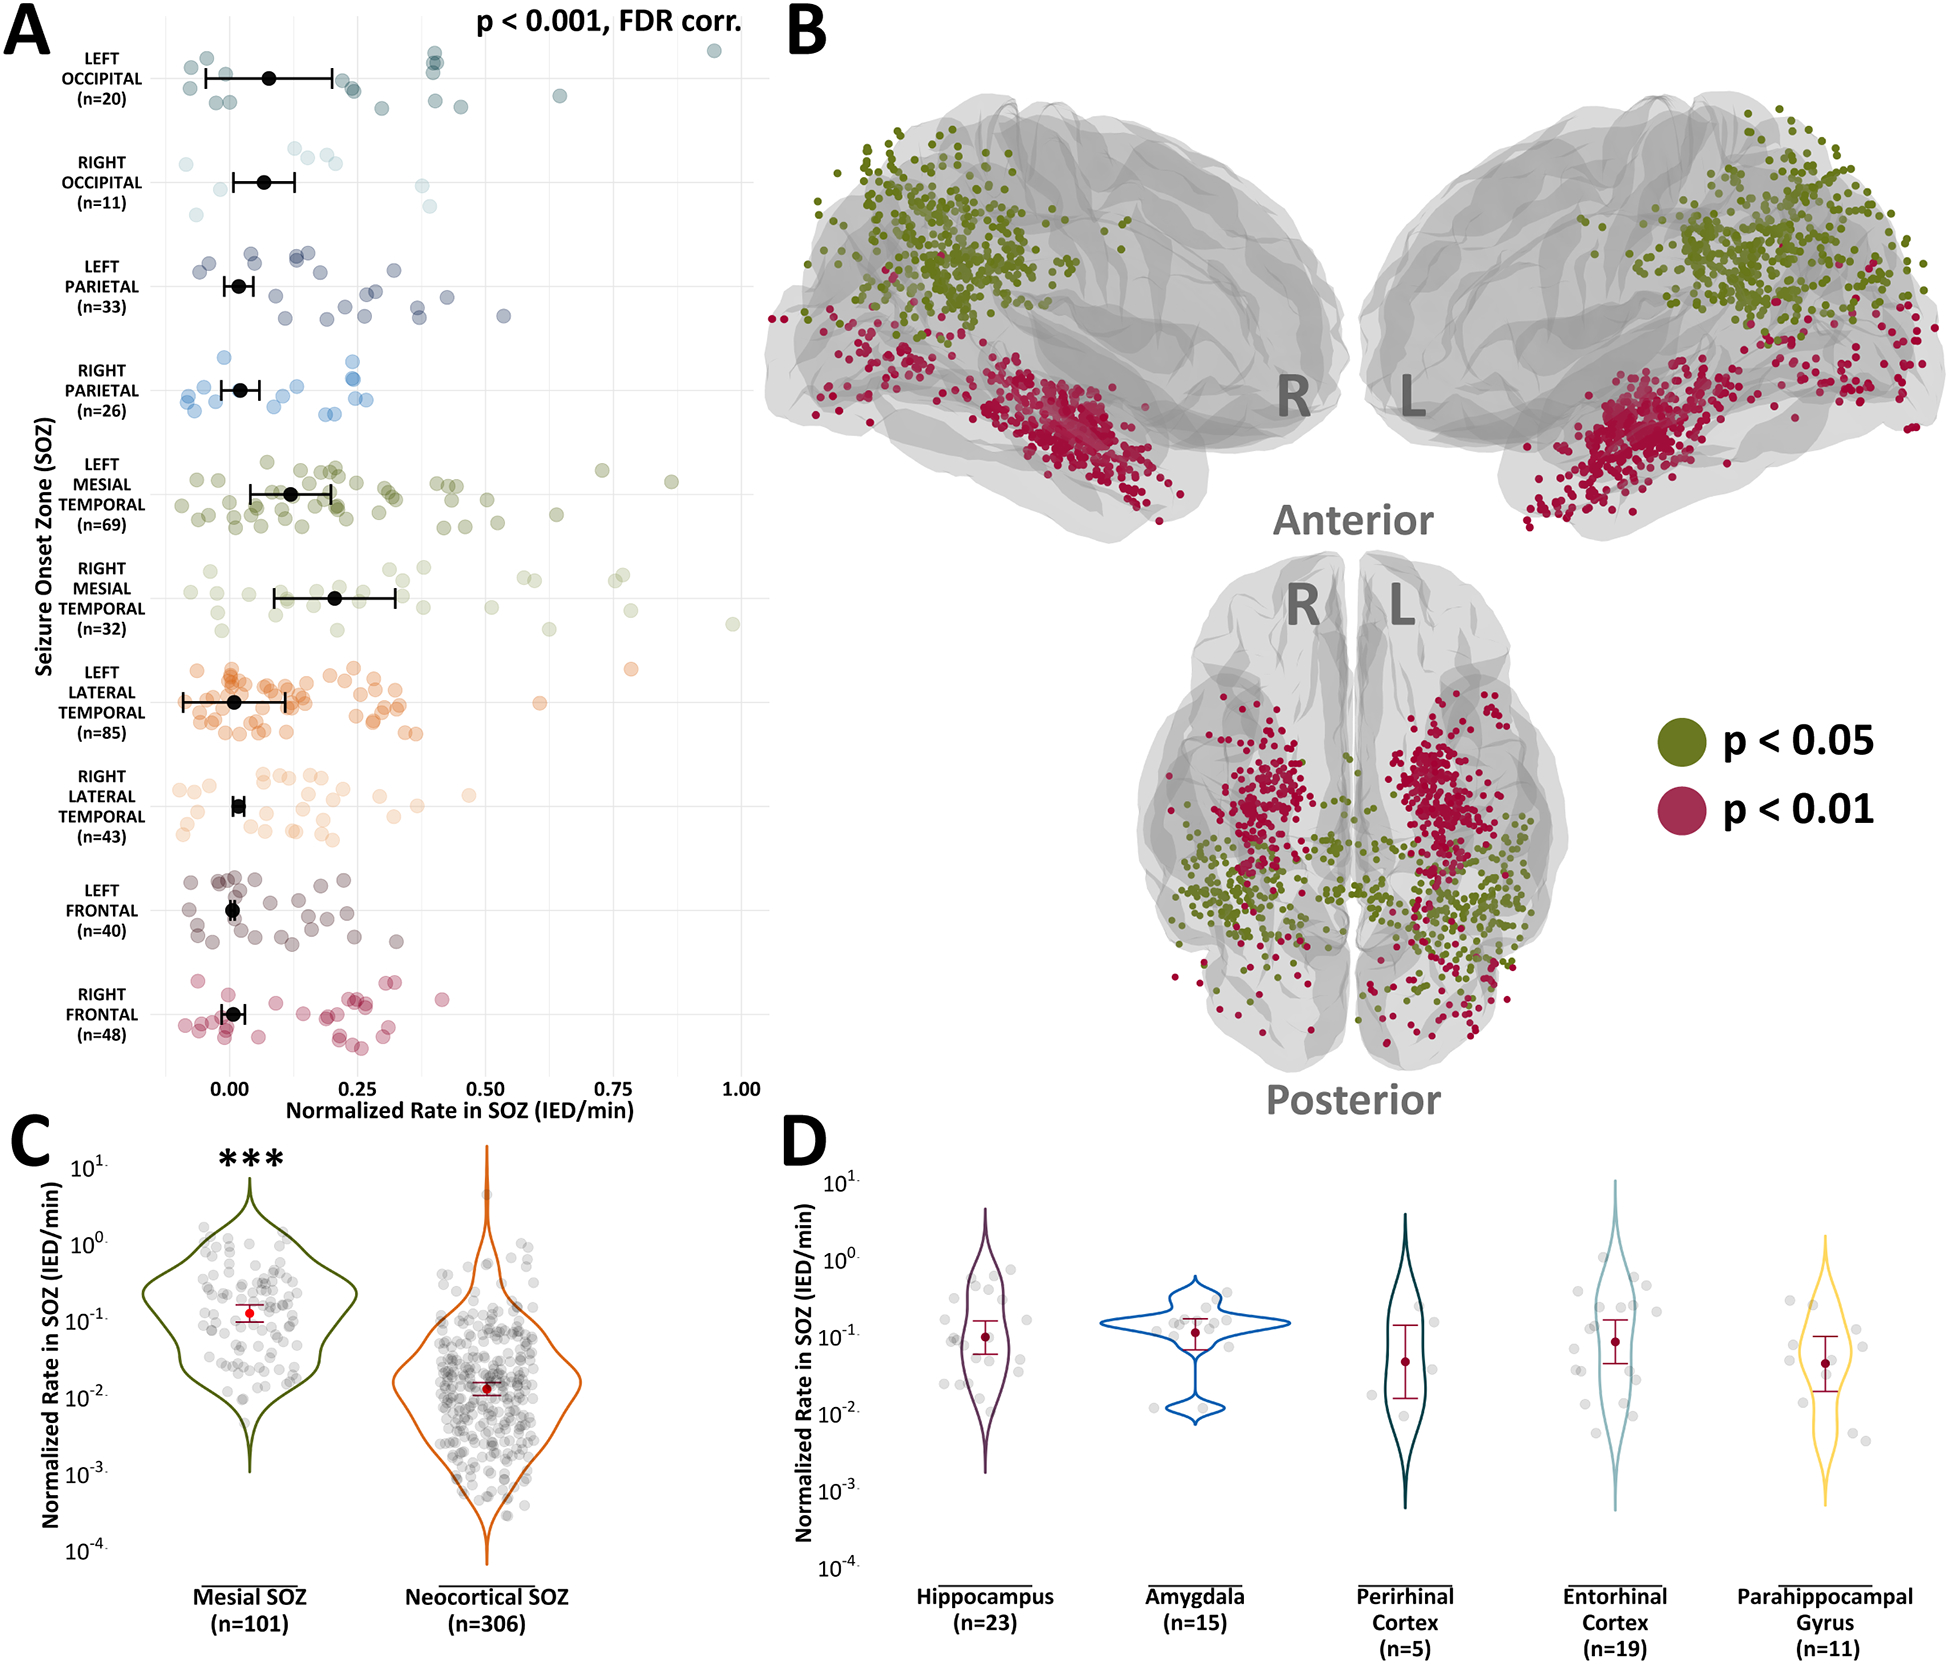
Figure 2. Seizure onset zone location influences interictal epileptiform discharge rates.

(A) Linear mixed-effects models were used to determine if there were differences in IED rates between the different SOZs, stratified by brain region. Here, we used normalized IED rates computed solely from electrode contacts in SOZs. ANOVA revealed that there were IED rate differences between the SOZs (p < 0.001). (B) Electrode contacts rendered on an average brain surface depict results from Tukey’s HSD test, a post-hoc test of the ANOVA in (A). Colors represent significance values for contacts in SOZ brain regions that had significantly higher normalized IED rates than other SOZ brain regions. (C) IED rates were higher in mesial structures compared to neocortical structures (p < 0.001). (D) There was a nonsignificant difference in IED rates between common mesial structures (p = 0.84). Bars represent 95% confidence intervals. * p < 0.05, ** p < 0.01, *** p < 0.001
