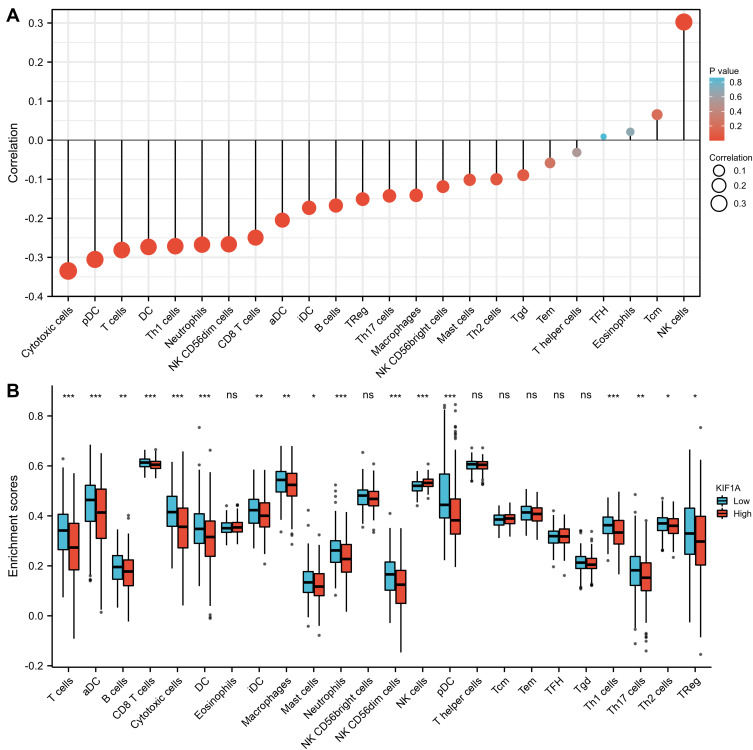
Figure 7.
The expression level of KIF1A was related to the immune infiltration in the tumor microenvironment. (A) The forest plot shows the correlation between KIF1A expression level and 24 immune cells. The size of dots indicates the absolute value of Spearman r. (B) The Wilcoxon rank sum test was used to analyze the difference of immune cell enrichment scores between KIF1A high and low expression groups. aDC [activated DC]; B cells; CD8 T cells; Cytotoxic cells; DC; Eosinophils; iDC [immature DC]; Macrophages; Mast cells; Neutrophils; NK CD56bright cells; NK CD56dim cells; NK cells; pDC [Plasmacytoid DC]; T cells; T helper cells; Tcm [T central memory]; Tem [T effector memory]; Tfh [T follicular helper]; Tgd [T gamma delta]; Th1 cells; Th17 cells; Th2 cells; Treg. Significance markers: ns, p≥0.05; *, p< 0.05; **, p<0.01; ***, p<0.001.

