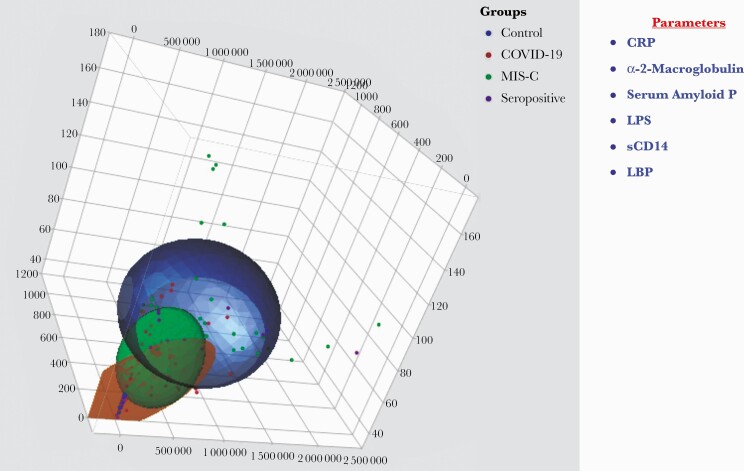
Figure 3.
PCA to estimate the discriminatory power of inflammatory markers in MIS-C, COVID-19, seropositive, and control children. The PCA plot presents normalized data from plasma levels of CRP, α 2M, SAP, LPS, sCD14, and LBP in combinations of 4 different experimental groups (MIS-C [colored in green], COVID-19 [colored in red], seropositive [colored in purple], controls [colored in blue]). Abbreviations: COVID-19, coronavirus disease 2019; CRP, C-reactive protein; LBP, lipid-binding protein; LPS, lipopolysaccharide; MIS-C, multisystem inflammatory syndrome in children; PCA, principle component analysis; SAP, serum amyloid P.

