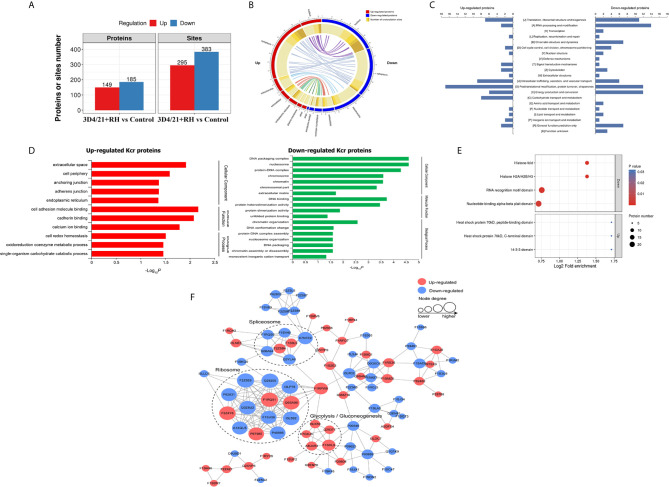
Figure 2.
Quantitative analysis of lysine crotonylation in porcine alveolar macrophages after T. gondii infection. (A) The differentially expressed Kcr proteins between 3D4/21+RH and control cells. (B) The differentially crotonylated proteins were classified based on subcellular location between 3D4/21+RH and control cells. (C) The differentially crotonylated proteins were analyzed by the KOG (Eukaryotic Orthologous Groups) database. (D) Bar graphs showing GO-based enrichment analysis of the differentially crotonylated proteins between 3D4/21+RH and control cells. (E) Bubble diagram showing protein domain enrichment analysis of the differentially crotonylated proteins between 3D4/21+RH and control cells. (F) Interaction networks of all identified Kcr proteins based on the STRING database.

