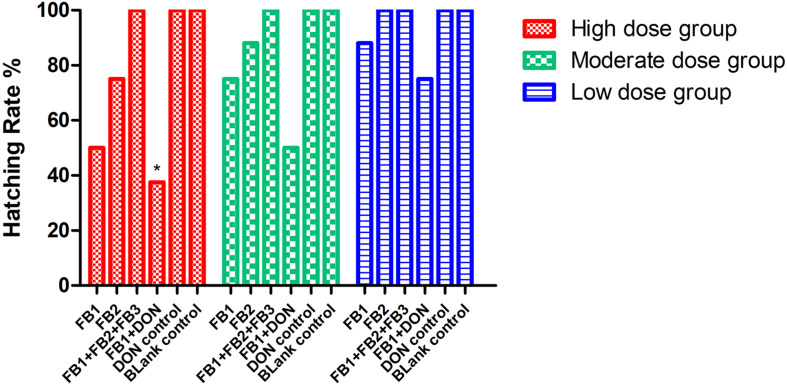
FIGURE 1.
Hatching rate post-inoculation with serial concentrations of FB or DON, or synergetic inoculation. *Indicates p < 0.05 when the high FB1 + DON group was compared to the high FB1 group, the high FB1 + FB2 + FB3 group, and the DON group (p = 0.037), while no significant difference was found when the moderate FB1 + DON group was compared to other moderate groups and the DON group (p = 0.114). Similarly, no statistical difference was found when the low FB1 + DON group was compared to other low groups (p = 0.427). The data were analyzed by Chi-square test with SPSS as the categorical variable.

