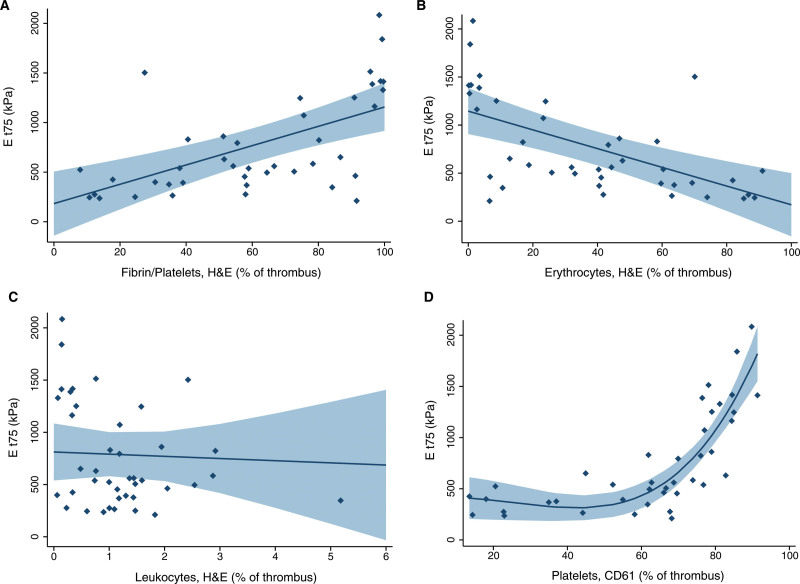
Figure 3.
Relationship of thrombus composition with thrombus stiffness (Et75) is shown. Margins plots including 95% confidence intervals for fibrin/platelets (A), erythrocytes (B), leukocytes (C) on H&E with Et75 and fitted curve including 95% confidence interval for platelets on CD61 (D) with Et75.

