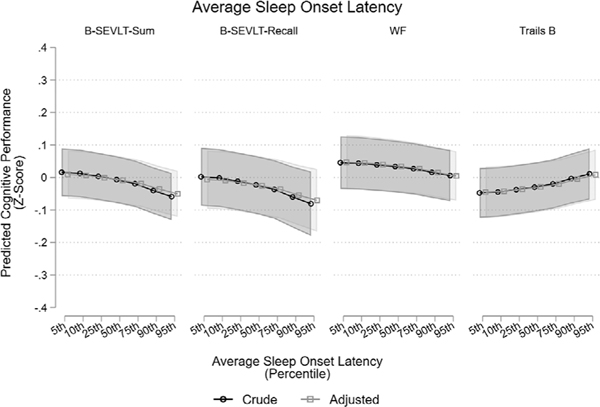
FIGURE 1.
Associations between average sleep-onset latency and neurocognitive performance at SOL-INCA. Notes: SOL-INCA was conducted between 2015 and 2018; on average 7 years after Visit-1 cognitive testing. Adjusted models include age, education, sex, ethnicity, time from INCA to Sueño, BMI, alcohol consumption, physical activity, heart failure, stroke/TIA, CESD-10, STAI-10, antidepressants use, center, REI, ESS, number of days in sleep study, and having at least 2 weekend days (yes, no). For Trails B higher values indicate worse function. BMI, body mass index; B-SEVLT, Brief-Spanish English Verbal Fluency Test; CESD, Center for Epidemiologic Studies Depression Scale; ESS, Epworth sleepiness scale; REI, respiratory event index; SOL-INCA, Study of Latinos-Investigation of Neurocognitive Aging; STAI, State-Trait Anxiety Inventory; TIA, transient ischemic attack; WF, Word Fluency

