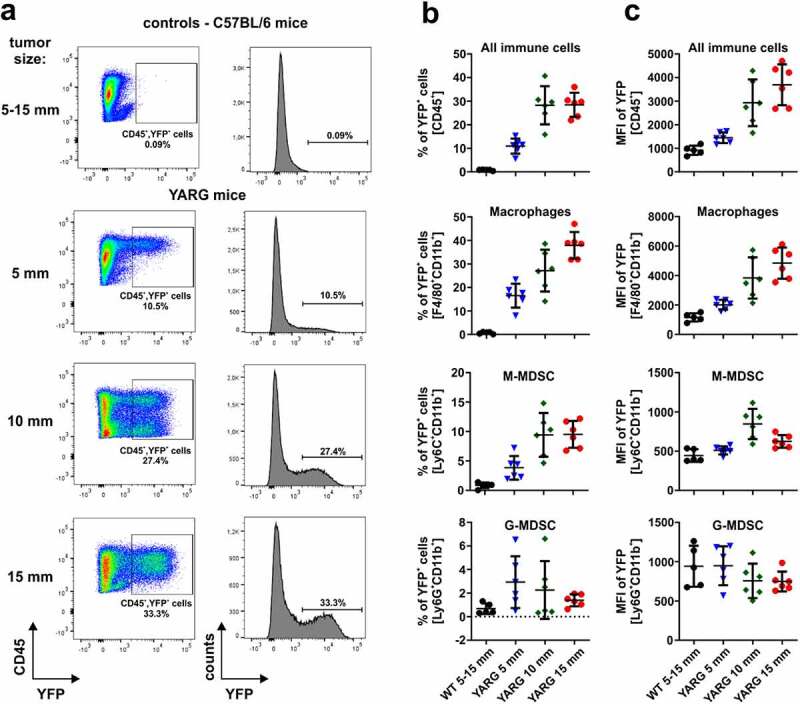
Figure 1.

Dynamics of 3LL tumors infiltration with Arg1-expressing immune cells. WT or YARG mice were inoculated subcutaneously with 1 × 10⁶ of 3LL cells and tumors were harvested when reached approximately 5, 10 or 15 mm in the largest diameter. Tumor samples were digested to single-cell suspension, stained with fluorochrome-coupled antibodies and analyzed in flow cytometry. A. Representative dot plots and histograms of WT and YARG mice showing gating for YFP+ cells. B. Percentages of YFP+ (Arg1+) cells within the populations of the total immune cells (CD45+), macrophages (CD11b+F4/80+), M-MDSC (CD11b+Ly6C+), and G-MDSC (CD11b+Ly6G+) infiltrating 3LL tumors at different stages of the disease progression. Data show means ± SD; n = 5–6. C. Mean fluorescence intensity (MFI) of YFP within the defined populations. Data show means ± SD; n = 5–6
