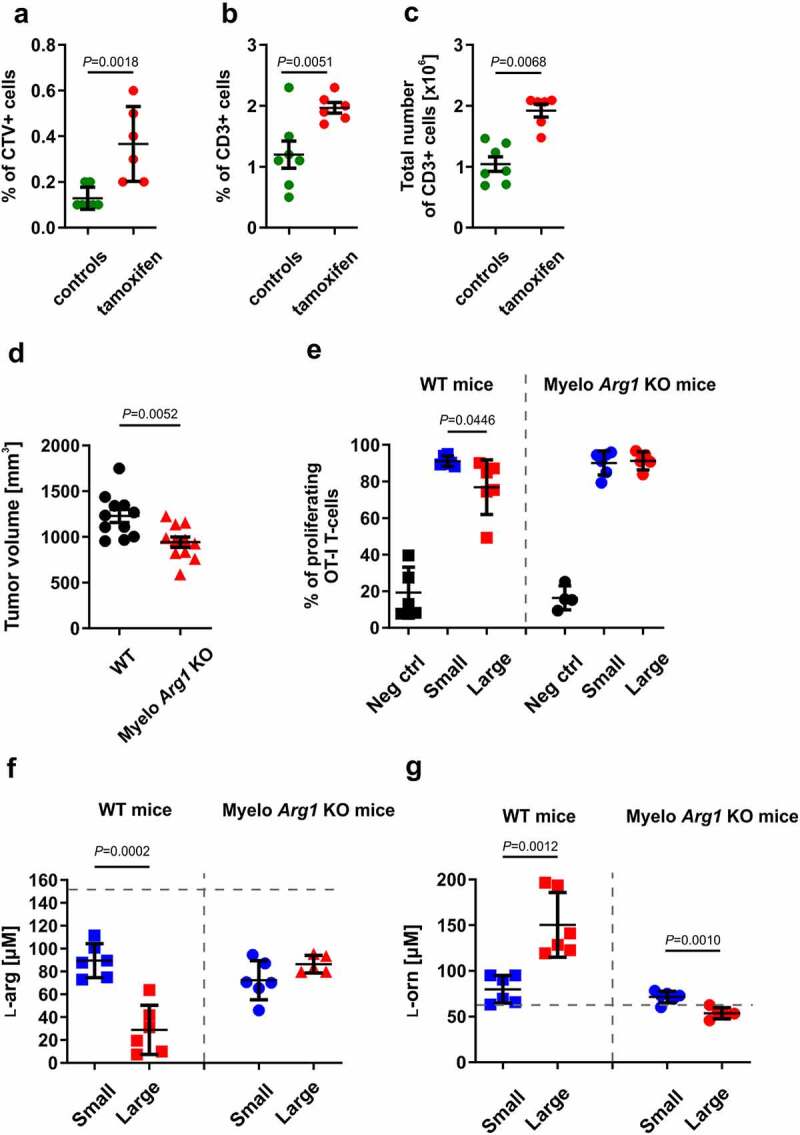
Figure 5.

Total or myeloid-specific Arg1 deficiency improves antigen-specific T-cells proliferation in 3LL-tumor-bearing mice. A-C. Inducible total Arg1 KO mice were inoculated subcutaneously with 0.5 × 10⁶ 3LL cells on day 0. Next, from day 7 until day 12 mice received tamoxifen (75 mg/kg p.o.) or peanut oil (solvent). On day 17 each mouse was inoculated i.v. with 4–6 × 10⁶ of CTV-stained OT-I T-cells. Antigen-specific proliferation was triggered with 5 µg of OVA protein injected subcutaneously in the tumor area on day 18. On day 21 tumor-draining lymph nodes were isolated for subsequent analysis. A. Percentages of adoptively transferred CTV+ OT-I T-cells in inguinal tumor-draining lymph nodes. Data show means ± SD; n = 6–7. P values were calculated with unpaired t-test. B. Percentage and C. absolute numbers of CD3+ tumor-infiltrating lymphocytes (TILs) analyzed in flow cytometry. Data show means ± SD; n = 6–7. P values were calculated with unpaired t-test. D-G. WT or myelo Arg1 KO mice were subcutaneously inoculated with 0.5 × 10⁶ of 3LL cells. D. Tumor volumes in WT or myelo Arg1 KO mice on day 17 after the inoculation of tumor cells. Data show means ± SD; n = 11. P values were calculated with unpaired t-test. E. Mice with small and large tumors were inoculated i.v. with 4–6 × 10⁶ of CTV-stained OT-I T-cells. Antigen-specific proliferation was triggered with 5 µg of OVA protein injected subcutaneously in the tumor area on the following day. Tumor-draining inguinal lymph nodes were isolated to determine percentages of proliferating OT-I T-cells 72 hours post immunization. Data show means ± SD; n = 4–6. P values were calculated with unpaired t-test; negative control (Neg ctrl) – WT mice 72 hrs post OT-I T-cells transfer without tumor and OVA protein immunization. F. ʟ-arginine (ʟ-arg) and G. ʟ-ornithine (ʟ-orn) concentrations in the plasma samples of WT or myelo Arg1 KO mice subcutaneously inoculated with 0.5 × 10⁶ of 3LL cells, assessed by mass spectrometry. Data show means ± SD; n = 5–6. P values were calculated with unpaired t-test. Dashed lines represent ʟ-arg and ʟ-orn concentrations in healthy C57BL/6 female mice (151 ± 5 µM and 59 ± 5 µM, respectively41)
