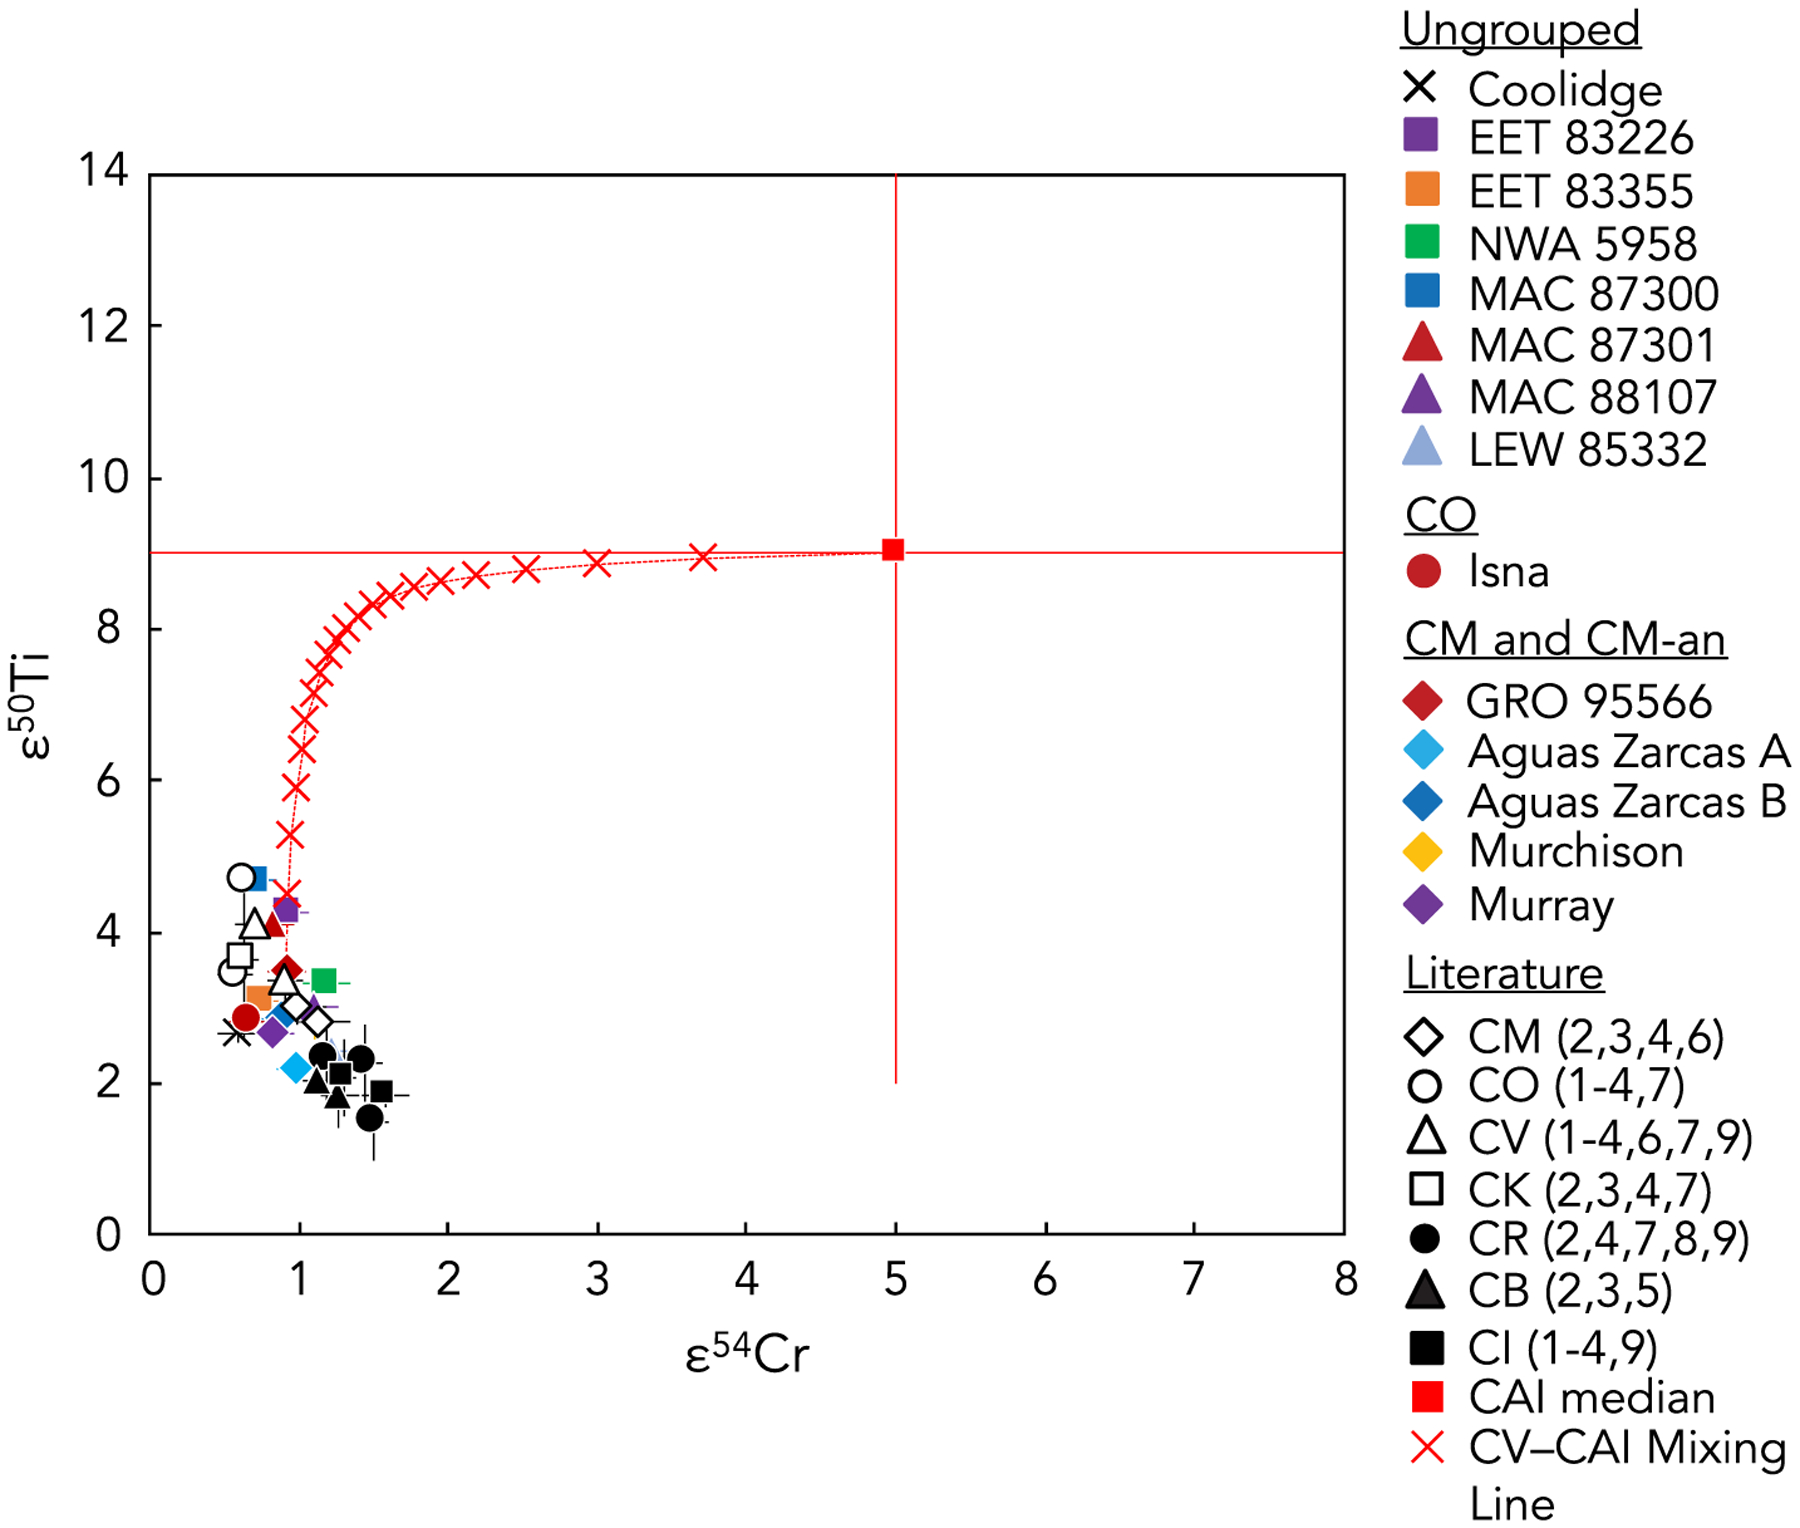
Fig. 5.

The calculated mixing trend (red line, red crosses) in ε50Ti versus ε54Cr space between bulk Allende CV chondrite composition (white triangle, located at one end of the mixing trend) and median CAI composition (solid red square, located at the other end of the mixing trend), plotted with bulk carbonaceous chondrite data from this study (colored symbols) and from the literature (solid and open black symbols; numbers in parentheses correspond to the same references as in Fig. 4). The bulk Allende CV chondrite endmember of the mixing trend is the average defined by the elemental abundances (Cr = 3600, Ti = 899 ppm) and isotopic compositions (ε54Cr = 0.90 ± 0.12, ε50Ti = 3.36 ± 0.36) previously reported for Allende (e.g., Shukolyukov and Lugmair, 2006; Trinquier et al., 2007, 2009; Qin et al., 2010; Zhang et al., 2012; Alexander, 2019; Torrano et al., 2019). The CAI endmember of the mixing trend is defined by the mean elemental abundances (Cr = 418 ppm, Ti = 4218 ppm) in the CAIs studied by Torrano et al. (2019) and the median Cr and Ti isotopic compositions of CAIs from the literature (ε50Ti = 9 and ε54Cr = 5; e.g., Dauphas and Schauble, 2016 and references therein; Davis et al., 2018; Render et al., 2019; Torrano et al., 2019). Each red cross on the mixing trend represents a 5% incremental addition of the CAI-like composition to a bulk Allende composition.
