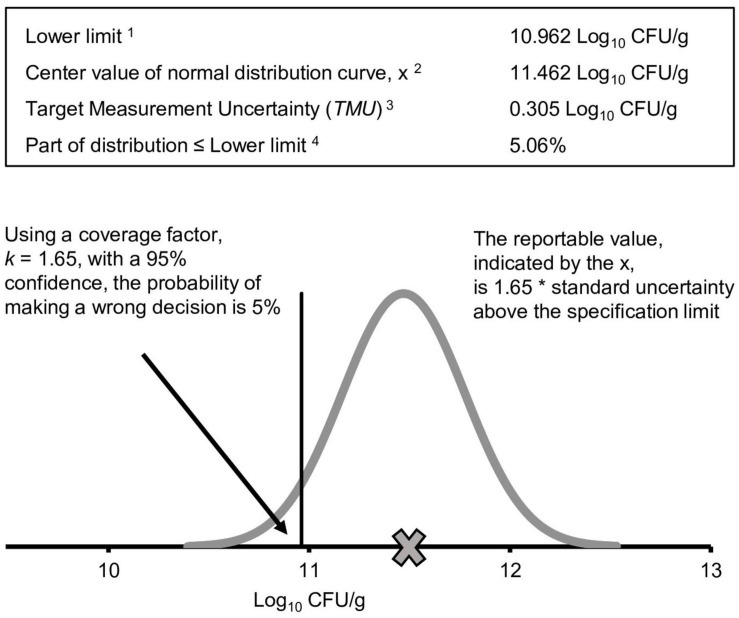
FIGURE 3.
Illustration and identification of the target measurement uncertainty (TMU). When the reportable value, shown by the x, is 1.65 × standard uncertainty above the lower limit, the probability of being wrong is 5%. 1Lower specification limit from the example Lactobacillus spp. 2X, the reportable value, is also the mean or mid-point of the distribution. 3For determining the TMU, the MS EXCEL formula, = NORM.DIST, can be used. For a lower limit, the formula is = NORM.DIST(lower limit, X, TMU, TRUE). In this example, the reportable value must be above the label claim to release the product. Therefore, lower limits are designated by label claims. The value of the TMU is varied until the formula matches the desired probability of being wrong. 4Probability of being wrong defined in the decision rule.

