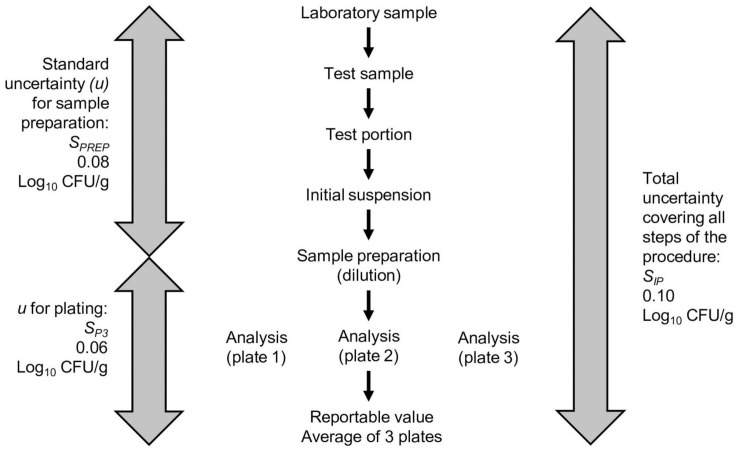
FIGURE 4.
Flow chart of the Lactobacillus spp. enumeration procedure. For each analysis, three plate counts are generated. The standard deviations for the plate count (Sp3) can be calculated from the triplicate plate count data to provide an estimate of the uncertainty from the plating and counting steps. The variance of the plate count can be subtracted from the variance covering the entire procedure to estimate the variance of the sample preparation (SPREP). The values shown are for the example Lactobacillus spp.

