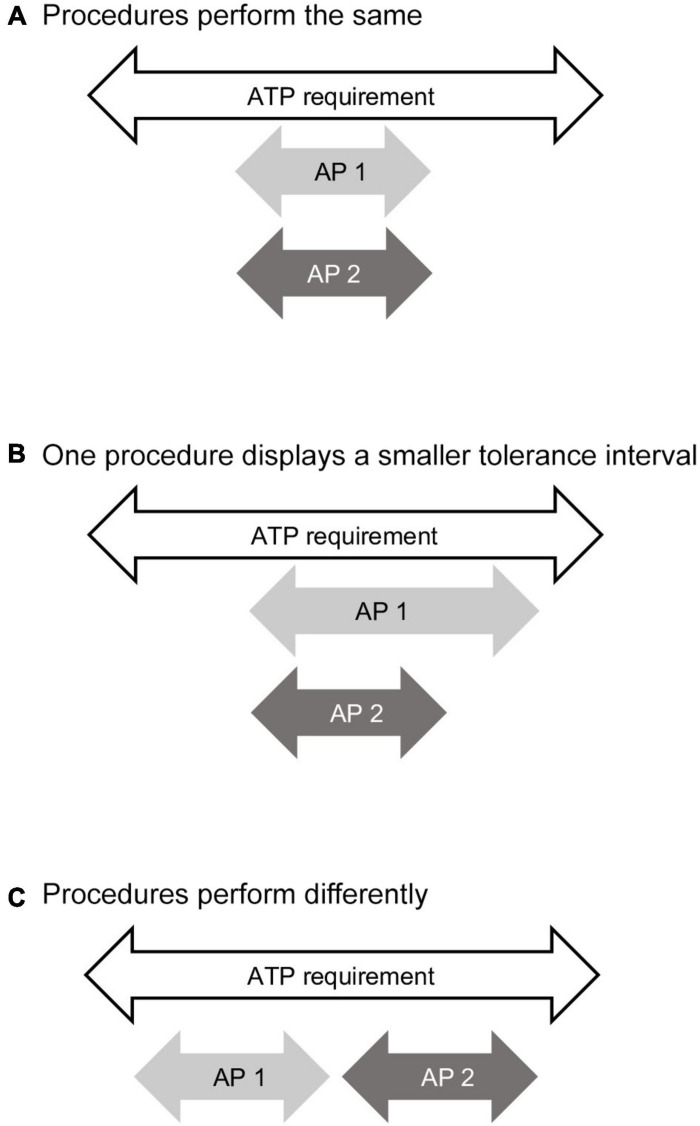
FIGURE 6.
Analytical procedure comparison using the analytical target profile (ATP) and tolerance intervals (TI). The white arrow represents the specification range required by the ATP for the analytical procedure to be fit for use. The light gray arrow (AP 1) represents the tolerance interval for one analytical procedure. The dark gray arrow (AP 2) represents the tolerance interval for the second analytical procedure. (A) Comparison showing both procedures perform the same. (B) Comparison showing the tolerance interval for procedure 1 is larger than procedure 2. (C) Comparison showing the two tolerance intervals of the two procedures do not overlap. In all situations both procedures are fit for use.

