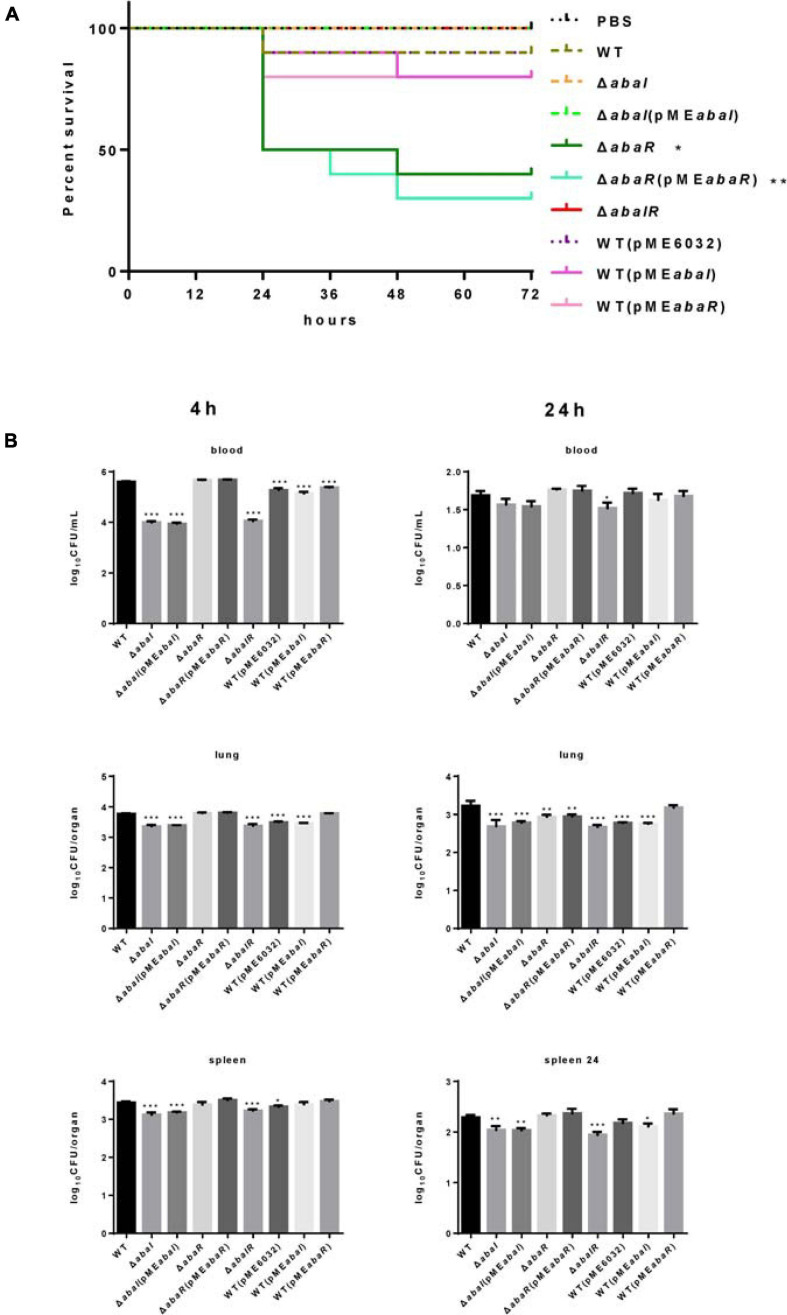
FIGURE 6.
(A) Kaplan–Meier survival curve of mouse inoculated with strains at a dose of 1.2 × 10⁸ CFUs (n = 10). Survival curves were compared using the log-rank (Mantel–Cox) test, *P < 0.05; **P < 0.005. (B) A. baumannii bacterial burdens in the lungs, spleen, and blood. Bacterial burdens in the blood and respective organs were determined by quantitative bacteriology at 4 and 24 h post inoculation. An unpaired t-test was used to validate the experimental data. *P < 0.05; **P < 0.005; ***P < 0.001.

