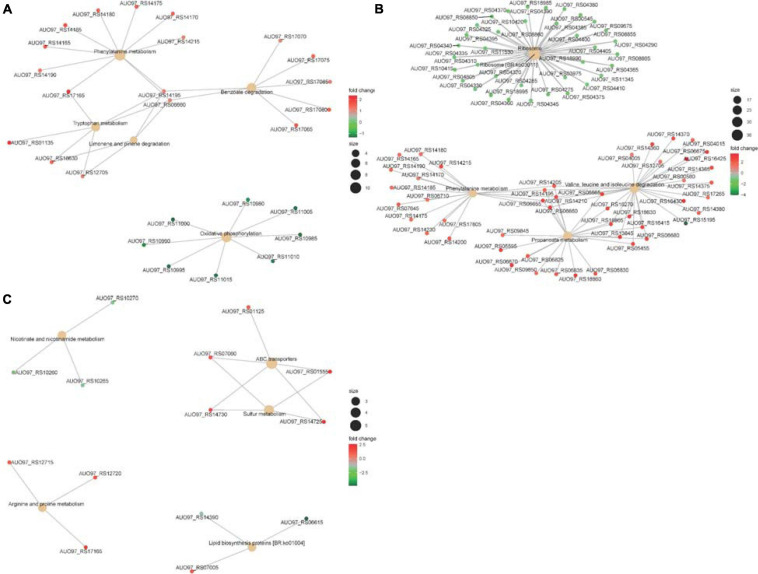
FIGURE 8.
(A) The top five significantly enriched KEGG pathways of DEGs in ΔabaI. The size of the nodes shows the number of genes enriched in each pathway. The color gradient shows the log2-fold change of gene expression. (B) The top five significantly enriched KEGG pathways of DEGs in ΔabaR. The size of the nodes shows the number of genes enriched in each pathway. The color gradient shows the log2-fold change of gene expression. (C) The top five significantly enriched KEGG pathways of DEGs in ΔabaIR. The size of the nodes shows the number of genes enriched in each pathway. The color gradient shows the log2-fold change of gene expression.

