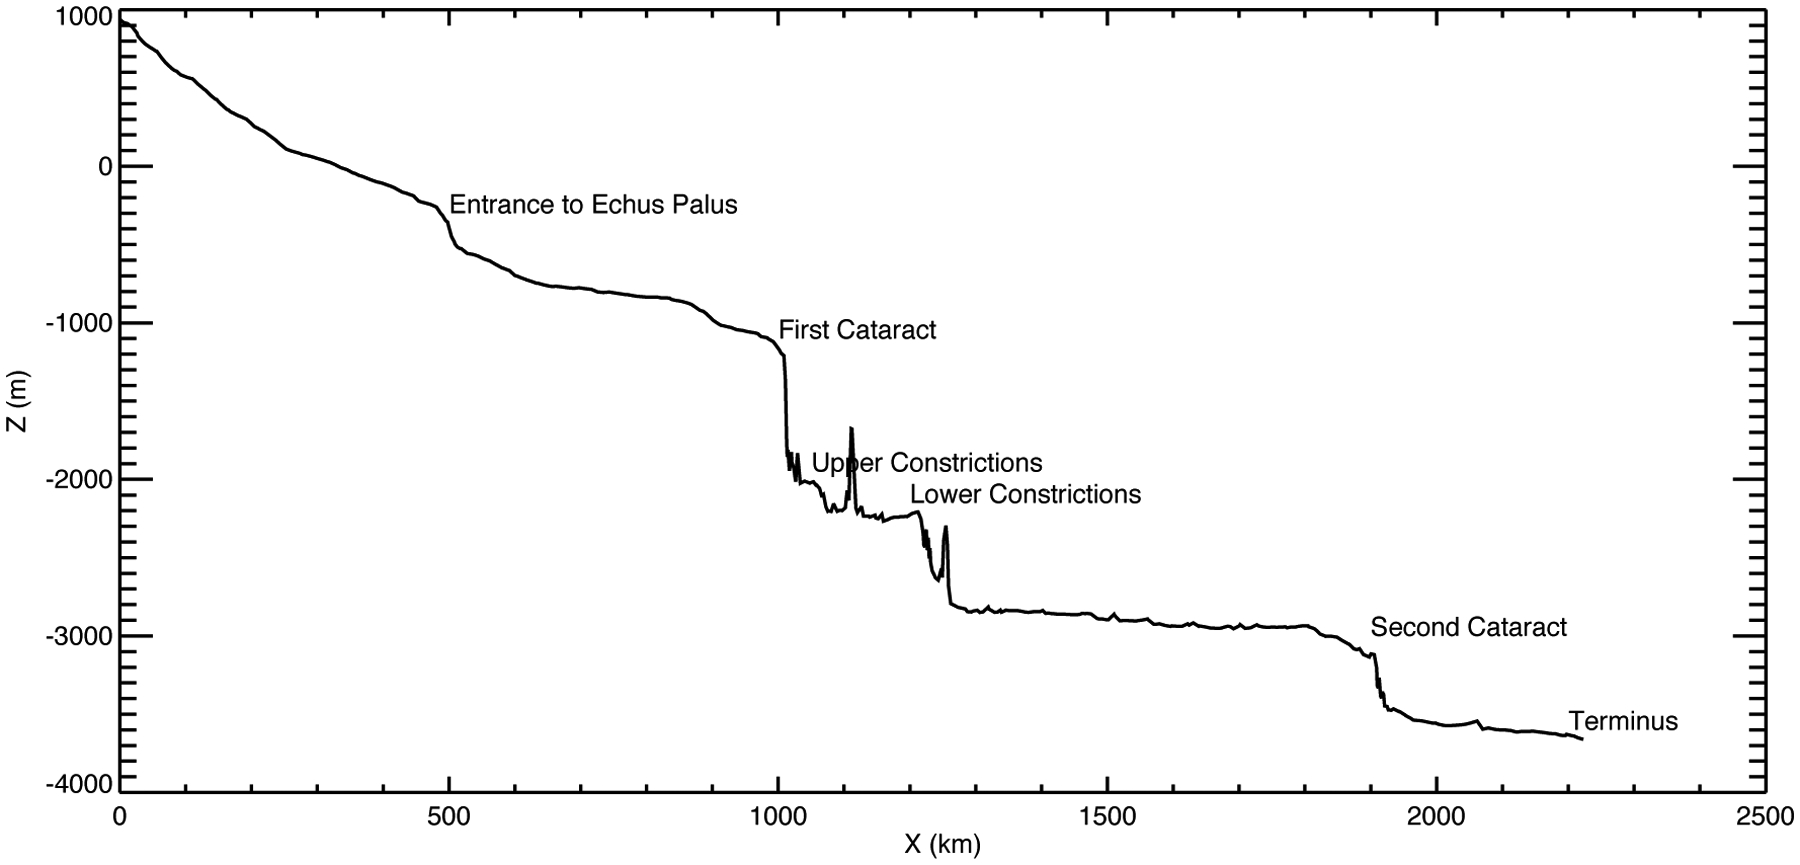
Figure 3.

Longitudinal profile of lava in South Kasei Valles based on MOLA DTM. The profile approximates the main lava flow path. Small spikes or apparent uphill sections are due to either post-flow impacts or imperfections in the DTM, such as poorly resolved constrictions.
