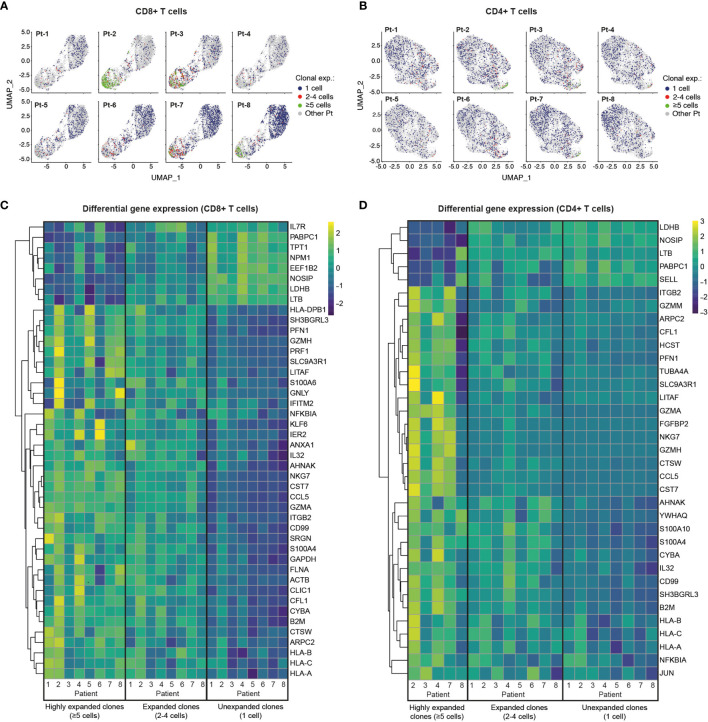
Figure 4.
Single-cell transcriptome and TCR sequencing reveals preferential clonal expansion in effector T cells. (A, B), UMAP plots display CD8+ (A) and CD4+ (B) T cells from specific patients according to their clonal expansion levels. T cells from other patients in each individual plot are shown in grey. (C, D), Heatmaps show differential gene expression (DGE) in unexpanded, expanded and highly expanded CD8+ (C) or CD4+ (D) T cells. Genes were filtered to include those with detectable expression in at least 50% of cells and that had a minimum 50% fold-change in expression level between groups.

