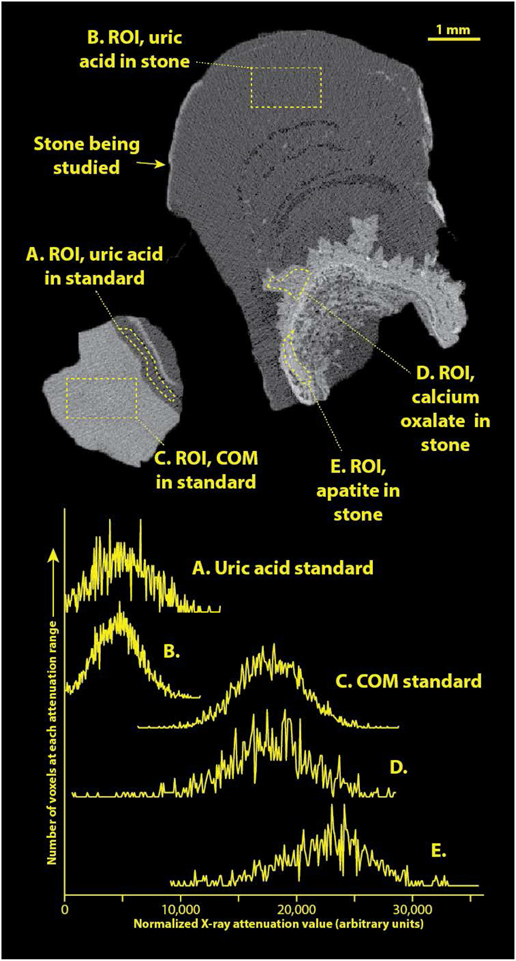
Figure 2.
Example of a patient specimen scanned along with the COM/uric acid standard. Top shows image slice of micro CT of specimen, right, and standard, left. Regions-of-interest (ROI’s) are shown as drawn within this image, and histograms of pixel values within each ROI are shown below. Note that the CT numbers from image slice have been transformed to match the arbitrary scale previously published [8]. For comparison, the actual linear attenuation coefficient (μ) of uric acid at this voltage is approximately 0.40/cm for uric acid stones, and 1.01/cm for COM [23].

