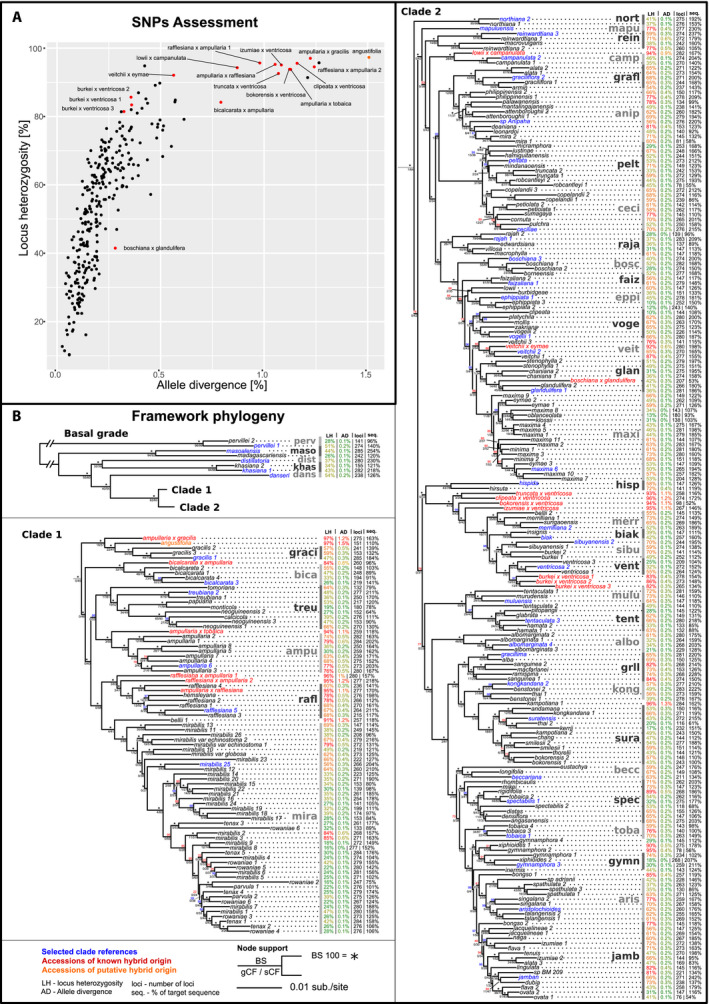
FIGURE 2.

(A) Scatterplot displaying the locus heterozygosity and allele divergence of samples. Known hybrids (red dots) and putative hybrid (orange dot) are labeled. (B) Phylogenetic tree of the consensus supermatrix displayed in three parts: the basal grade with two diverging clades, clade 1 below, and clade 2 on the right. Summary statistics for each accession are given: locus heterozygosity (LH), allele divergence (AD), number of loci (loci), and proportion of target sequence recovered (seq.). Clades selected for clade association are shown in gray with bars. Clade references are displayed in blue, known hybrids in red, and the putative hybrid in orange. Node support is shown above the node in bootstrap (BS) (*=BS100), and below the node in gene and site concordance factors (gCF/sCF).
