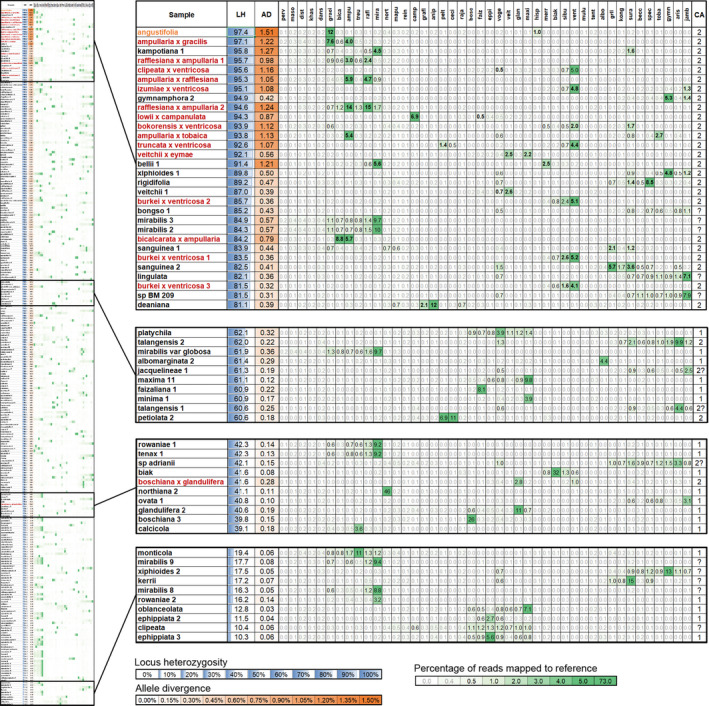
FIGURE 3.

Clade association table and heatmap displaying the percentage of reads matching to each of the 44 clade references. The complete table is on the left, with extracts of example rows shown on the right. The table includes locus heterozygosity (LH) and allele divergence (AD), percentages of reads matching to each reference, and the number of clade associations (CA). Known hybrids are in red, and the putative hybrid is in orange.
