
FIGURE 2.
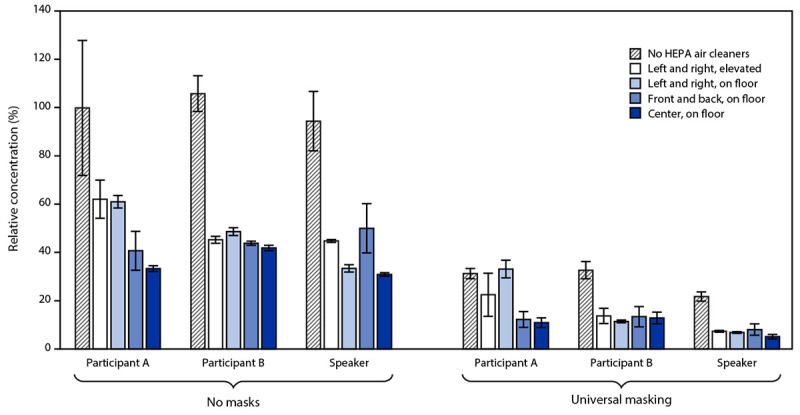
Concentrations* of aerosol particles at mouths of two participants and speaker relative to the combined average concentration measured for participants and speaker when high efficiency particulate air cleaners were not used and masks were not worn† — United States, 2021
Abbreviation: HEPA = high efficiency particulate air.
* The aerosol concentrations were measured at the mouths of two simulated participant receivers and simulated speaker receiver for 60 minutes while the simulated infected participant source exhaled aerosols into the room.
† The legend indicates the locations of the HEPA air cleaners in the room. Each bar is the mean of four experiments. Error bars show the standard deviations.