FIG 5.
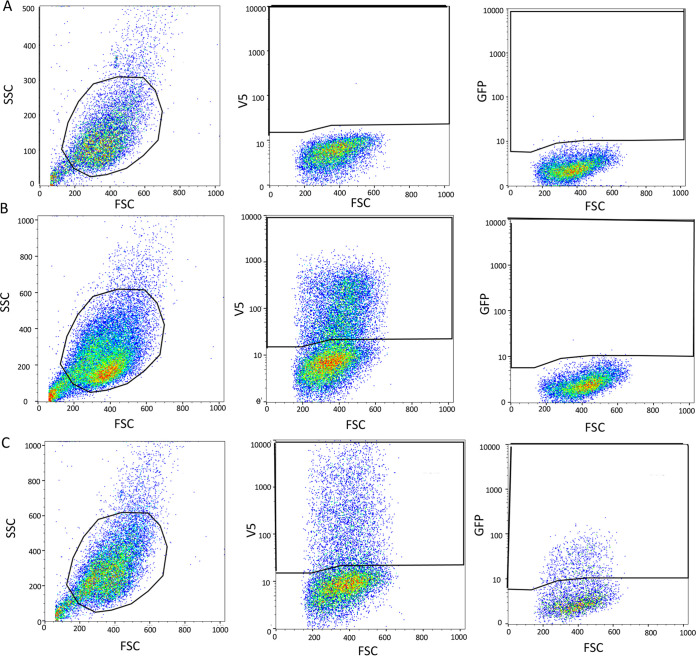
Flow cytometry gating strategy. (A) Mock: cells were infected with VACV-GFP1-9 and mock transfected. From left to right are the gated cell population, V5-stained cells from the gated cell population, and GFP fluorescence. (B) Negative interaction. Cells were infected with VACV-GFP1-9 and transfected with A16-HA-GFP10 and A28-V5-GFP11. From left to right: gated cell population, V5-stained cells from gated cell population, GFP expression in V5-stained population. (C) Positive interaction. Cells were infected with VACV-GFP1-9 and transfected with H2-HA-GFP10 and A28-V5-GFP11. The images as described for panel B.

