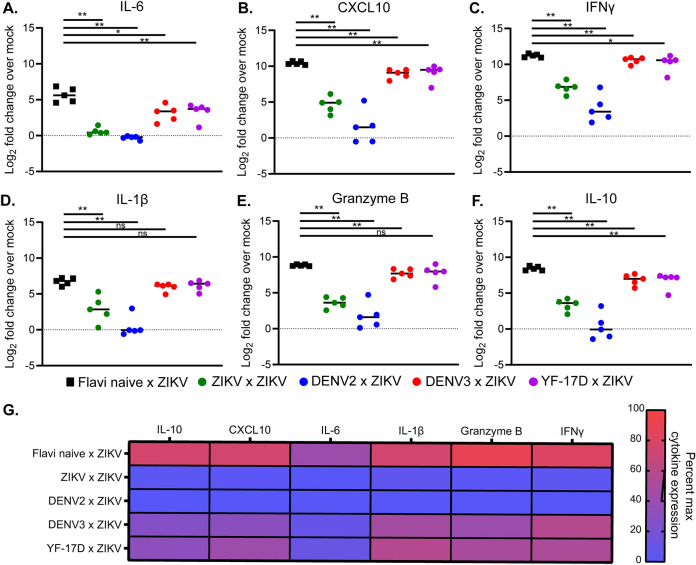
FIG 5.
Cytokine expression profiles in the brain during heterologous infection. At day 8 post ZIKV challenge, RNA was isolated from the brains of infected mice or a naive control group (n = 5 per group) (the same mice that were used to determine viral burden in the CNS by qRT-PCR were used). qRT-PCR was performed to measure the mRNA expression levels of IL-6 (A), CXCL10 (B), IFN-γ (C), IL-1β (D), granzyme B (E), and IL-10 (F). Differences in mRNA expression levels were determined by 2−ΔΔCT analysis. Expression levels are displayed as Log2 fold increases over expression of the cytokine in the brains of naive Ifnar1−/− mice. Statistical significance was determined by Mann-Whitney test (*, P = 0.03; **, P = 0.002; ***, P = 0.0002; ****, P < 0.0001). (G) Heat map displaying mean cytokine expression data for each group represented as a percent of the maximum expression level for a given cytokine.

