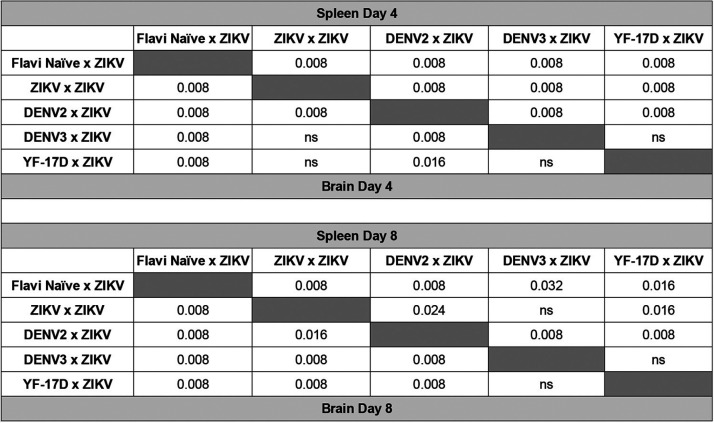
TABLE 2.
Statistical comparison between ZIKV titers measured by qRT-PCR in the spleens and brains at days 4 and 8 post ZIKV challengea
Viral load was compared between each group by Mann-Whitney test. Significant P values are indicated for comparison between the groups; ns is used to denote the comparison were the P value was above 0.05.

