. 2021 Jul 26;129(7):076003. doi: 10.1289/EHP8421

Figure 2.

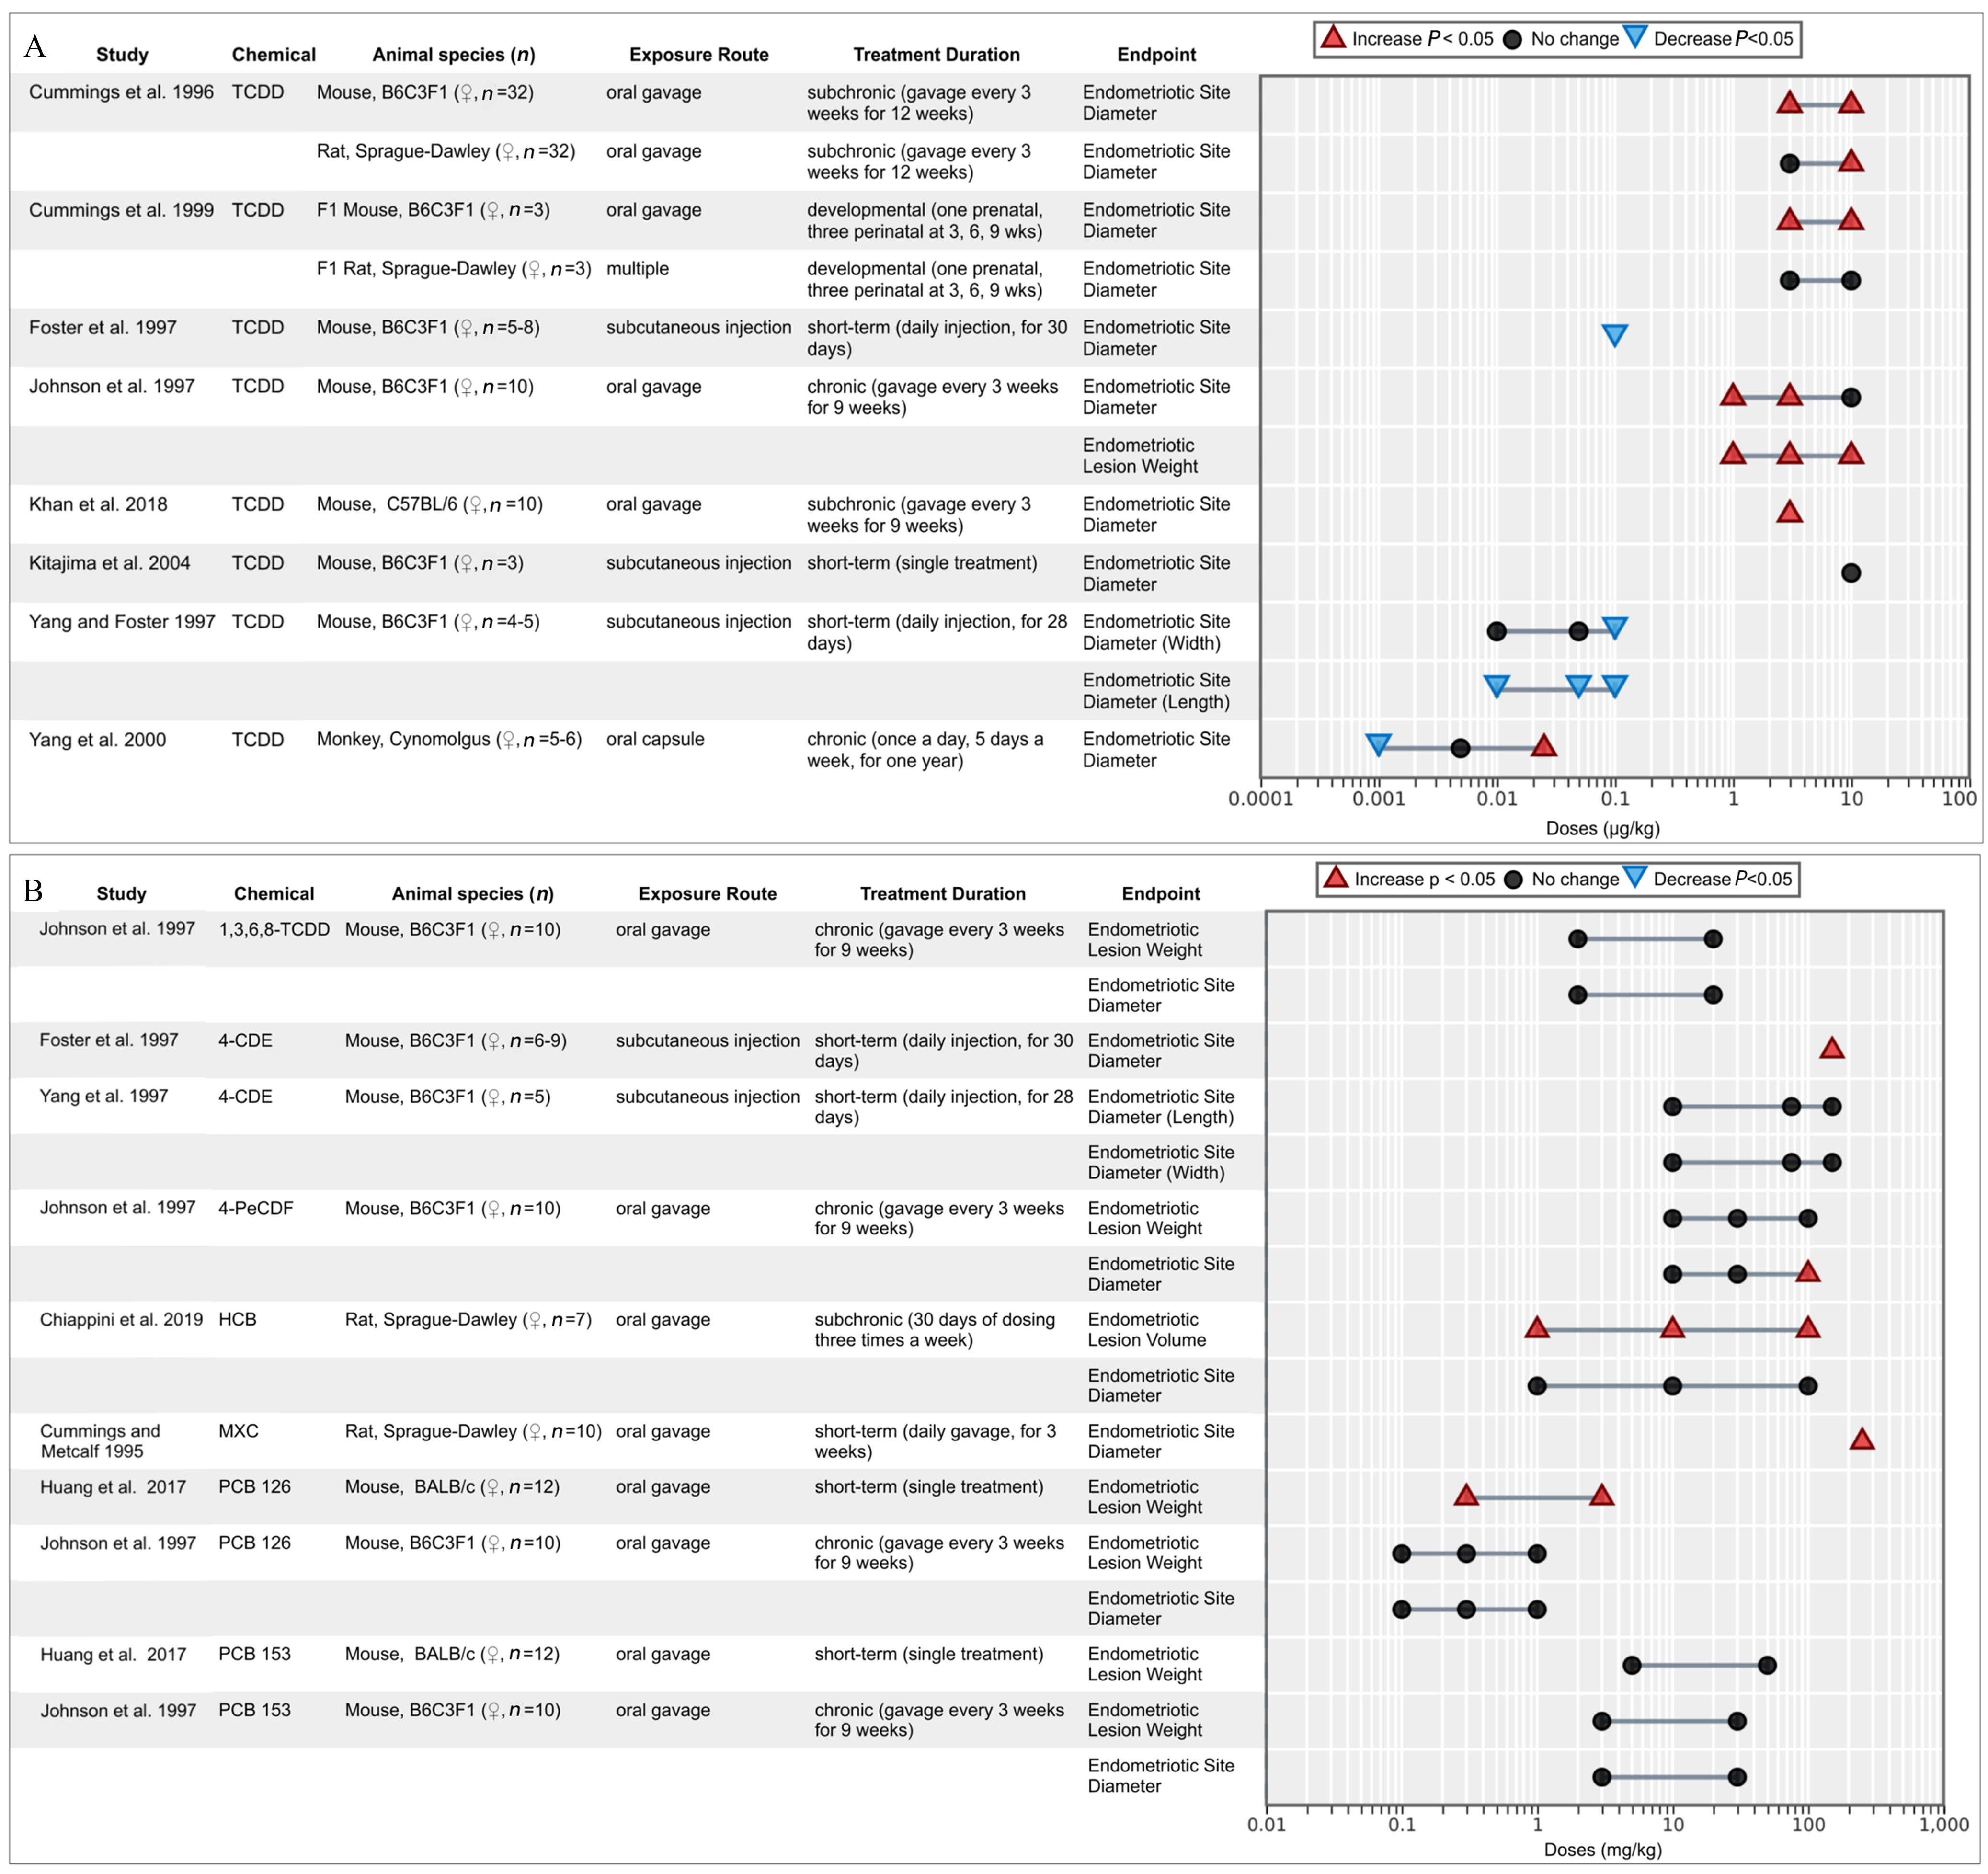
Figures 2A and 2B have one tabular representation and one line graph. The tabular representation has twelve and fifteen rows, and six columns, namely, Study, Chemical, Animal species (lowercase n), Exposure Route, Treatment Duration, and Endpoint. The line graph plots organochlorine chemicals and Lesion growth (y-axis) across doses (microgram per kilogram), ranging from 0.0001 to 0.001 in increments of 0.0009; 0.001 to 0.01 in increments of 0.009; 0.01 to 0.1 in increments of 0.09; 0.1 to 1 in increments of 0.9; 1 to 10 in increments of 9; and 10 to 100 in increments of 90; and 0.01 to 0.1 in increments of 0.09; 0.1 to 1 in increments of 0.9; 1 to 10 in increments of 9; 10 to 100 in increments of 90, and 100 to 1000 in increments of 900 (x-axis) for increase uppercase italic p less than 0.05, no change, and decrease uppercase p less than 0.05, respectively.

Associations between endometriotic lesion growth (measured in diameter, volume, and weight) reported from in vivo studies for TCDD (2A) and other organochlorine chemicals (2B). Lesion growth was measured in diameter, volume, and weight.