. 2021 Jul 26;129(7):076003. doi: 10.1289/EHP8421

Figure 7.

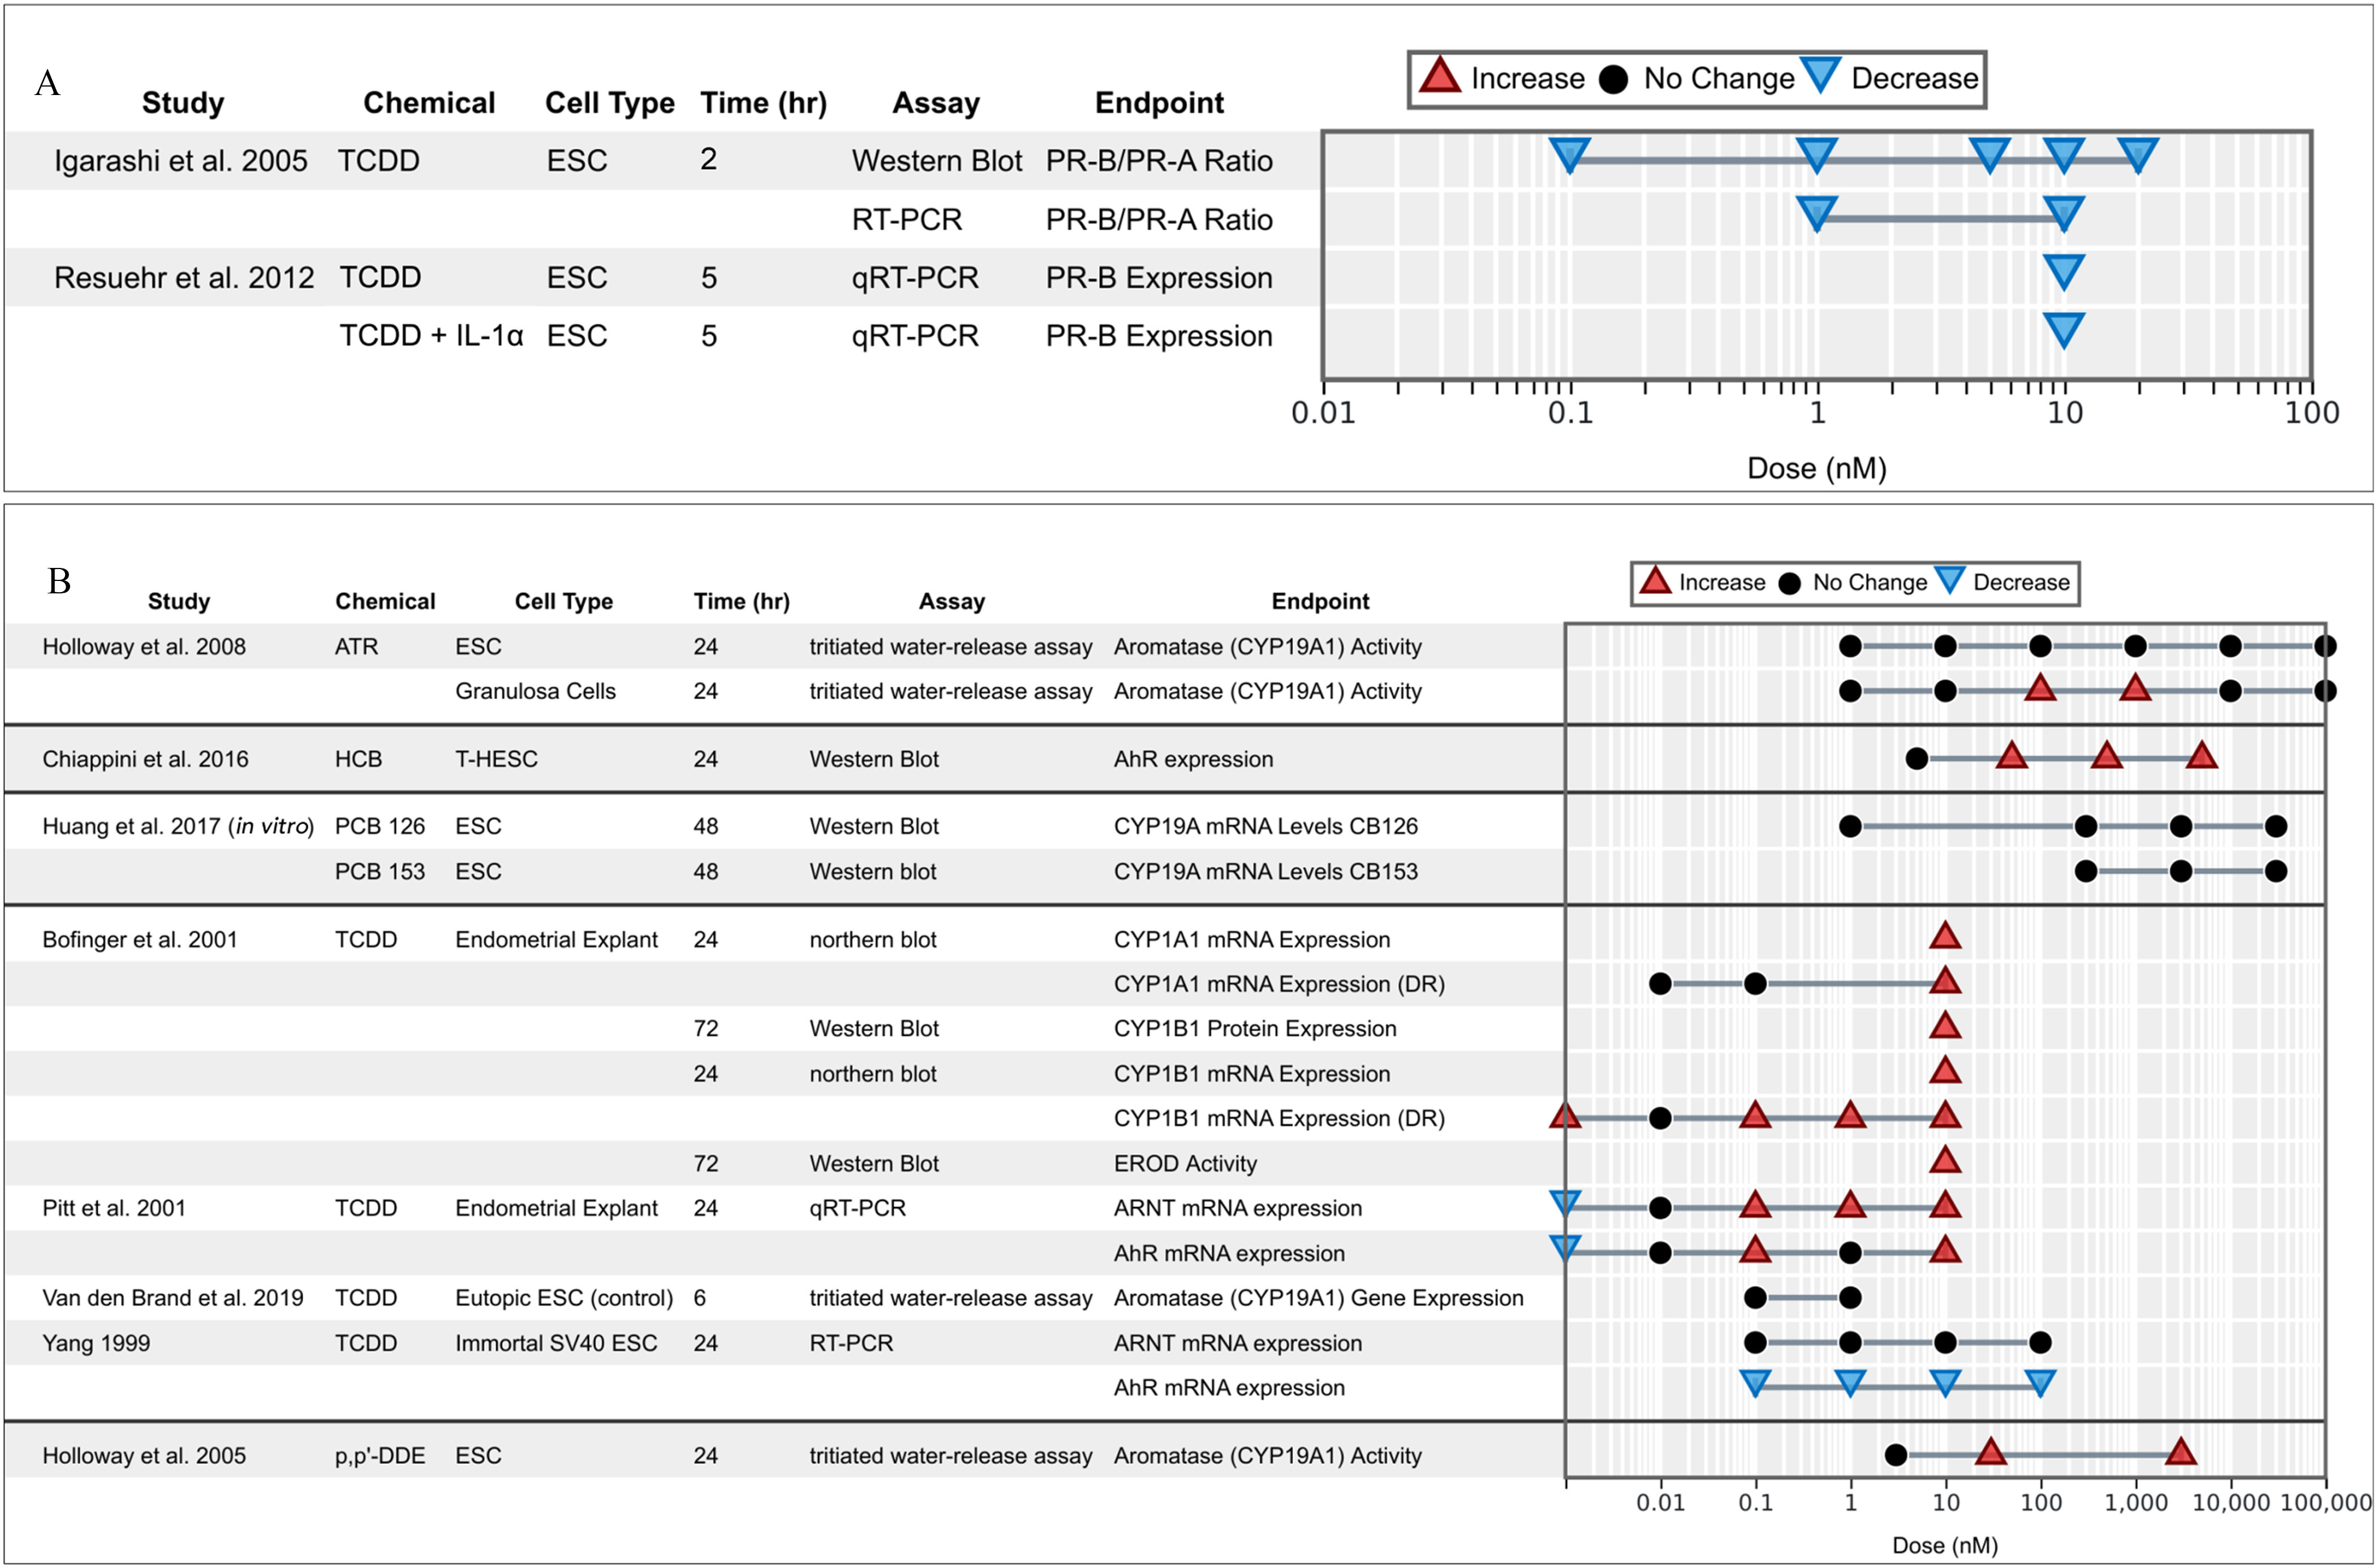
Figures 7A and 7B each has one tabular representation and one line graph. The tabular representation has four and seventeen rows, and six columns, namely, Study, Chemical, Call type, Time (hour), Assay, and End point. The line graph, plotting progesterone receptor and Aryl hydrocarbon receptor or Aryl hydrocarbon receptor nuclear translocator and aromatase (cytochrome P450) related activities (y-axis) across dose (nanomolar), ranging from 0.01 to 0.1 in increments of 0.09; 0.1 to 1 in increments of 0.9; 1 to 10 in increments of 9; 10 to 100 in increments of 90, and 0.01 to 0.1 in increments of 0.09; 0.1 to 1 in increments of 0.9; 1 to 10 in increments of 9; 10 to 100 in increments of 90; 100 to 1000 in increments of 900; 1000 to 10000 in increments of 9000; 10000 to 100000 in increments of 90000 (x-axis) for increase, no change, and decrease, respectively.

Associations between exposure to organochlorine chemicals and (A) the progesterone receptor and (B) AhR/ARNT and aromatase (CYO19A1) related activities and expression reported from in vitro studies. Endometrial stromal cells (ESCs) marked with case or control indicate that the cells were derived from women with endometriosis (case) or without (control).