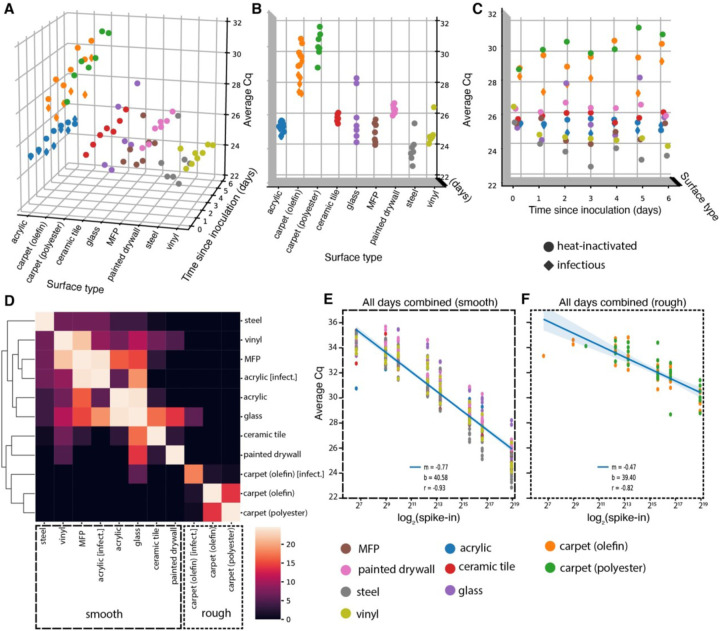
Figure 2:
(A-C) 3D scatterplots showing distribution of average Cq of viral gene calls over seven days for nine different surfaces inoculated with 5×10⁵ GEs (nine surfaces for heat-inactivated virus [circles], two (acrylic and olefin carpet) for infectious [diamonds]). The distribution of Cq’s differs significantly across surface types (B), but not across days since inoculation (C). (D) Clustermap of the U statistic from pairwise Mann-Whitney U tests between surface types. (E-F) Standard curves relating surface viral load (spike-in) to average Cq across all time-points for smooth (E) and rough (F) surface types.

