
. 2021 Jun 25;14(2):98–103. doi: 10.4103/JETS.JETS_55_20
Copyright: © 2021 Journal of Emergencies, Trauma, and Shock
This is an open access journal, and articles are distributed under the terms of the Creative Commons Attribution-NonCommercial-ShareAlike 4.0 License, which allows others to remix, tweak, and build upon the work non-commercially, as long as appropriate credit is given and the new creations are licensed under the identical terms.
Figure 4.
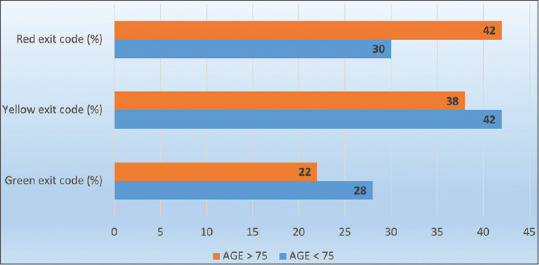
Bar graph showing the exit codes distribution