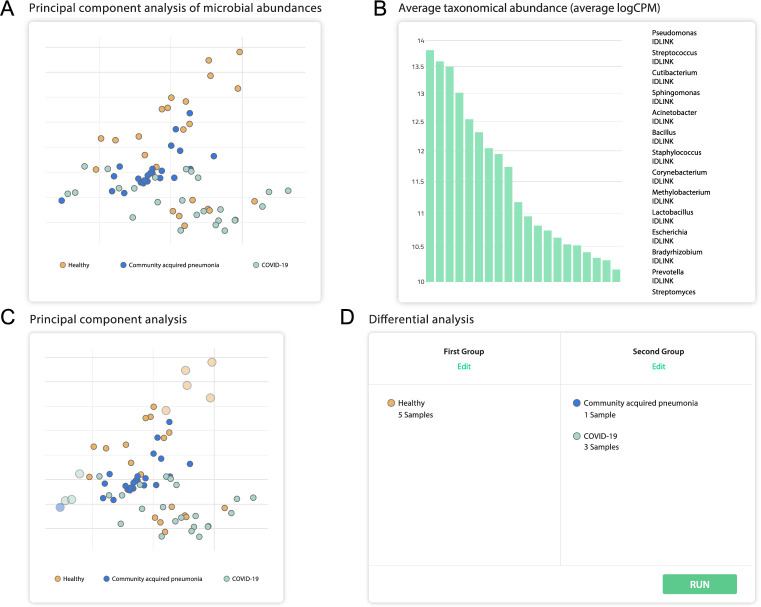
Fig 3. Overview of selected functionalities offered by the platform and their associated displays.
These results were generated using experimental samples obtained from [33], which includes metatranscriptomic data for 8 severe and 23 non-severe COVID-19 cases. (A) PCA analysis of microbial abundance. (B) Average taxonomic abundance (X-axis: different taxa, ordered from left-to-right in the same order as in the graph legend. Y-axis: logCPM (counts per million expressed in base 10 logarithm)). (C) Interactive plot which can be used to select the samples to be used for microbial differential presence analysis. (D) Additionally, two groups can be chosen manually to perform a subsequent analysis using the deseq2 software.

