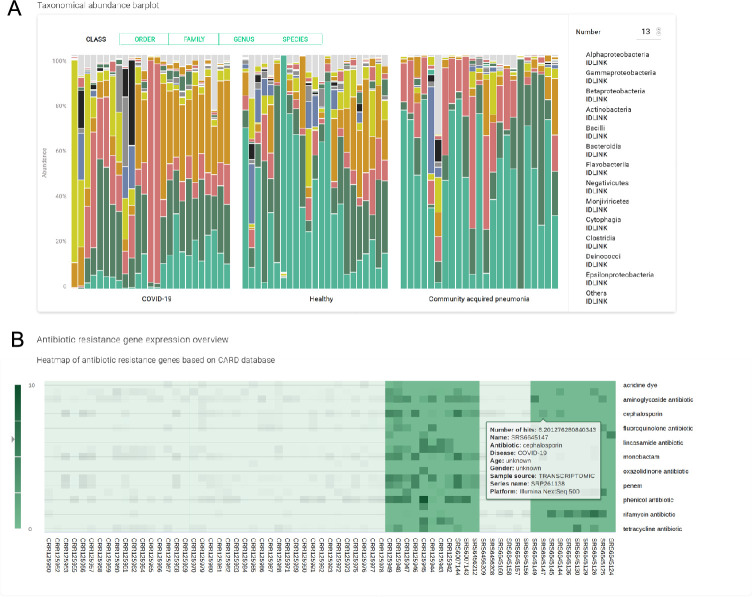
Fig 4. Overview of selected functionalities offered by the platform.
(A) A bar plot shows the presence of the most common microbial classes, the number and level of the taxa could be specified by the user. (B) The heatmap shows the expression levels of the genes known to provide resistance to certain antibiotics. The dataset used to generate the plots was obtained from [33].

