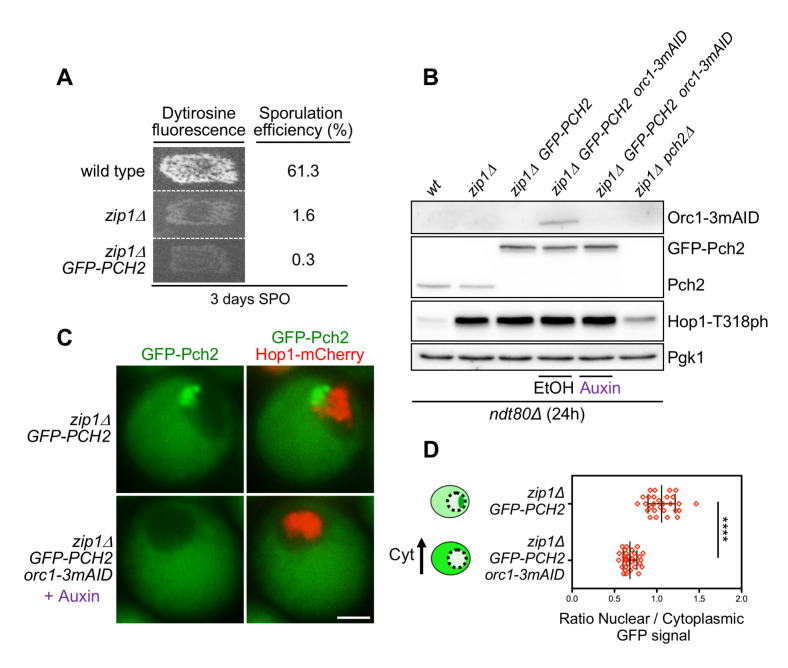
Fig 1. Cytoplasmic accumulation of Pch2 upon Orc1 depletion supports checkpoint activity.
(A) Functional analysis of the GFP-tagged version of PCH2. Dityrosine fluorescence, as a visual indicator of sporulation, and sporulation efficiency were examined after 3 days on sporulation plates. Strains are DP421 (wild type), DP422 (zip1Δ) and DP1621 (zip1Δ GFP-PCH2). (B) Western blot analysis of Orc1-3mAID production (detected with an anti-mAID antibody), GFP-Pch2 and Pch2 production (detected with an anti-Pch2 antibody), and Hop1-T318 phosphorylation. Pgk1 was used as loading control. Strains are DP424 (ndt80Δ), DP428 (ndt80Δ zip1Δ), DP1640 (ndt80Δ zip1Δ GFP-PCH2), DP1630 (ndt80Δ zip1Δ orc1-3mAID GFP-PCH2) and DP881 (ndt80Δ zip1Δ pch2Δ). EtOH or auxin (500 μM) was added to orc1-3mAID cultures at 12 h. Samples were collected at 24 h after meiotic induction. (C) Fluorescence microscopy analysis of GFP-Pch2 (green) and Hop1-mCherry (red) distribution in whole meiotic cells 16 h after meiotic induction. Representative cells are shown. Scale bar, 2 μm. (D) Quantification of the ratio between the nuclear (including the nucleolar) and cytoplasmic mean GFP fluorescent signal. Error bars: SD. The cartoon illustrates the subcellular localization of GFP-Pch2 (green) in the different conditions. The strains in (C) and (D) are DP1636 (zip1Δ GFP-PCH2) and DP1633 (zip1Δ orc1-3mAID GFP-PCH2). Auxin (500 μM) was added to the orc1-3mAID culture 12 hours after meiotic induction.

