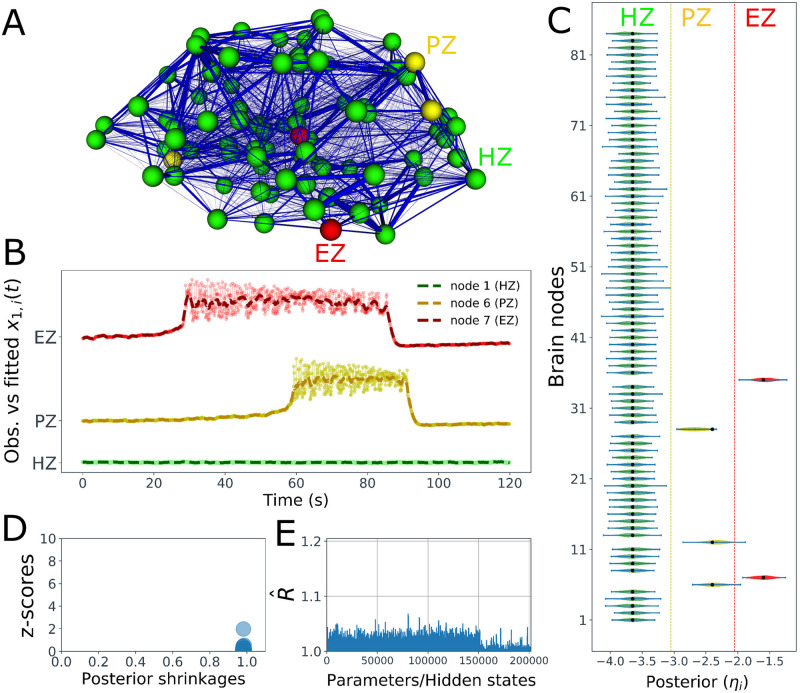
Fig 2. Estimation of the spatial map of epileptogenicity across different brain regions in the BVEP model.
(A) The constructed VEP brain model; the patient-specific functional brain network model consisting of 68 cortical regions and 16 subcortical structures furnished with the spatial map of epileptogenicity (EZ, PZ, and HZ). Each brain region is represented as one node of the network, with color indicating its epileptogenicity (red: EZ, yellow: PZ, green: HZ). Thickness of the blue lines indicates the strength of the connections between brain regions (SC matrix). (B) Exemplary of the full VEP model simulation (dash-dotted lines) versus the fitted reduced VEP model (dashed lines) for three brain node types EZ, PZ, and HZ, shown in red, yellow, and green, respectively. (C) Violin plots of the estimated densities of excitability parameters for 84 brain regions included in the analysis. The ground truth values are displayed by the filled black circles. (D) The distribution of posterior z-scores and posterior shrinkages for all the inferred excitabilities confirms the accuracy and the reliability of the model inversion. (E) The values of for all of the hidden states and parameters estimated by NUTS algorithm (lower than 1.05) implying that the HMC chain has converged.

