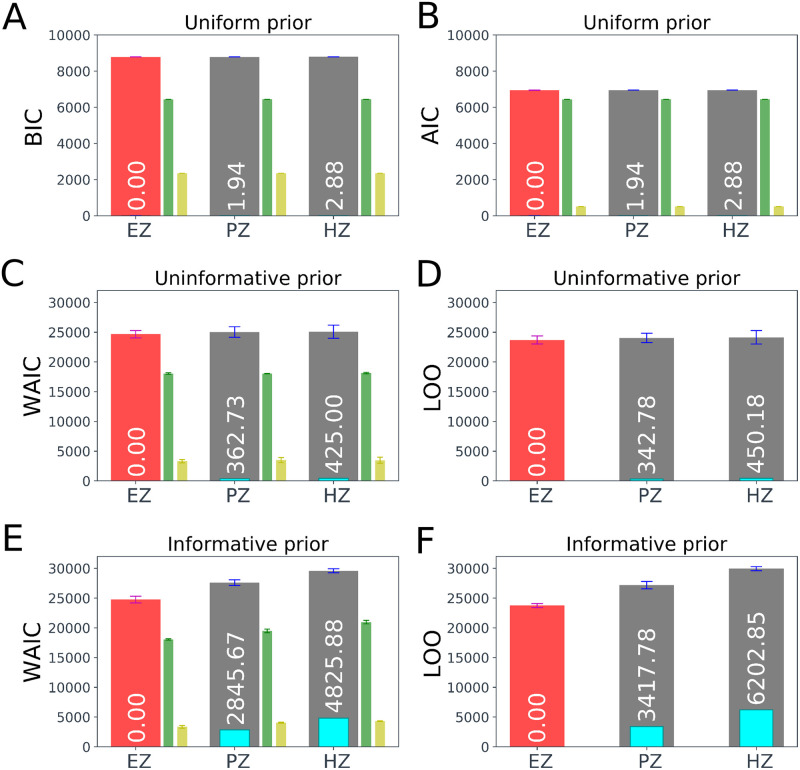
Fig 4. Epileptogenicity hypothesis testing using classical and Bayesian information criteria.
The computed BIC, AIC, WAIC, LOO, and their Delta scores (color bars in cyan, text in white color) averaged over 4 estimations for each of the EZ, PZ, and HZ hypothesis, while the correct hypothesis for the selected brain node corresponds to the EZ (shown in red). The deviance (-2 times log predictive density, in green), and the penalty term (in yellow) are also displayed for BIC, AIC, and WAIC. (A) and (B) illustrate the computed BIC and AIC, respectively, assuming a truncated uniform prior on the excitability parameter. (C) and (D) show the computed WAIC and LOO, respectively, assuming an uninformative Gaussian prior on the excitability parameter (σ = 100). (E) and (F) show WAIC and LOO, respectively, but obtained by placing an informative prior on the excitability parameter (σ = 0.01). The smaller the value of each information criterion, the better the model’s predictive ability. The best epileptogenicity hypothesis (smallest BIC/AIC/WAIC/LOO) has a Delta score of zero (shown in red), whereas an epileptogenicity hypothesis with a Delta score of larger than 10.0 has essentially no support. The error bar represents the standard error.

