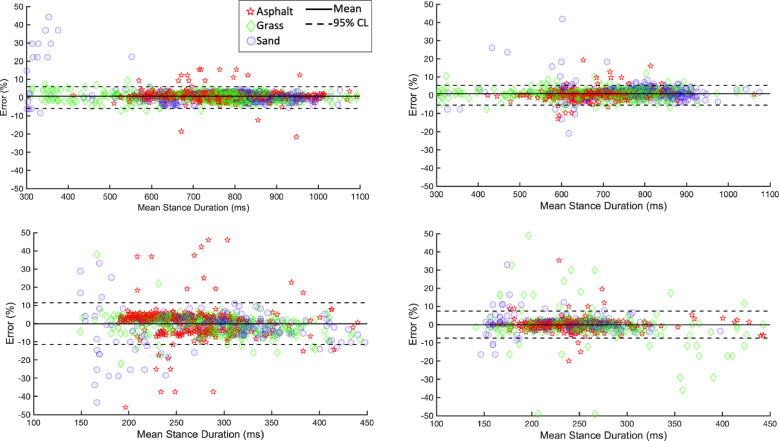
Fig 6. Bland-Altman plots of novel methods compared to reference method to calculate stance duration on each surface.
The difference between stance durations calculated using reference method and best novel method for each event (shown as a percentage of stride duration) as a function of the mean of the two. Stance durations from control surface are shown as red stars, from grass as green diamonds and from sand as blue circles. The solid horizontal lines (-) indicate the mean error and dashed horizontal lines (- -) the ULoA and LLoA.

