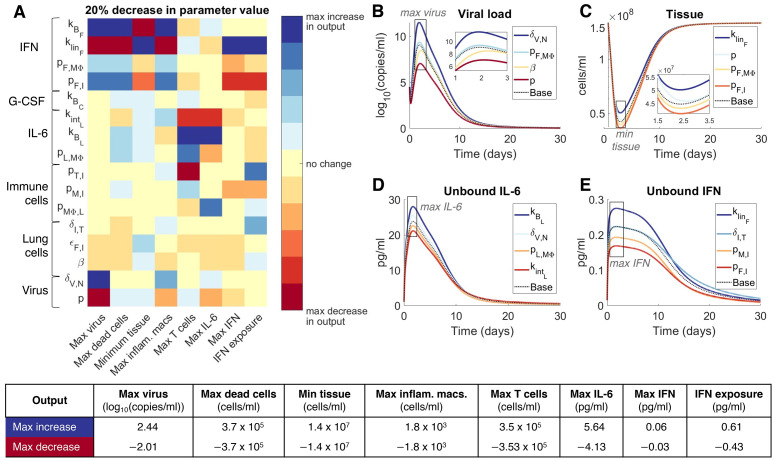
Fig 5. Parameters driving COVID-19 severity.
A local sensitivity analysis was performed by varying each parameter ±20% from its originally estimated value (mild disease parameters in Fig 4) and simulating the model. Predictions were then compared to baseline considering: Maximum viral load (max(V)), maximum concentration of dead cells (max(D)), minimum uninfected live cells (min(S+R)), maximum concentration of inflammatory macrophages (max(MΦI)), maximum number of CD8+ T cells (max(T)), maximum concentration of IL-6 (max(LU)), maximum concentration of type I IFN (max(FU)) and the total exposure to type I IFN (FU exposure). A) Heat map shows the magnitude of the change of each metric from a 20% decrease in the parameter value compared to baseline (i.e. model simulation with no change in the parameter values), where blue signifies the maximum value observed in the output metric and red signifies the minimum value observed (i.e. maximum decrease in that metric). The most sensitive parameters are shown here, for the complete parameter sensitivity results, see S9 Fig. The explicit value of the maximum increase and maximum decrease of each metric is given in the table below. B)-E) time-series dynamics of viral load, tissue (uninfected cells), and unbound IL-6 and IFN given 20% decreases in the noted parameters. Colours of the curves correspond to the colouring of the heatmap in A. Maximal(minimal) concentrations, as in A, are noted in grey boxes. E) is coloured according to IFN exposure. Base: original mild parameters (Fig 4).

