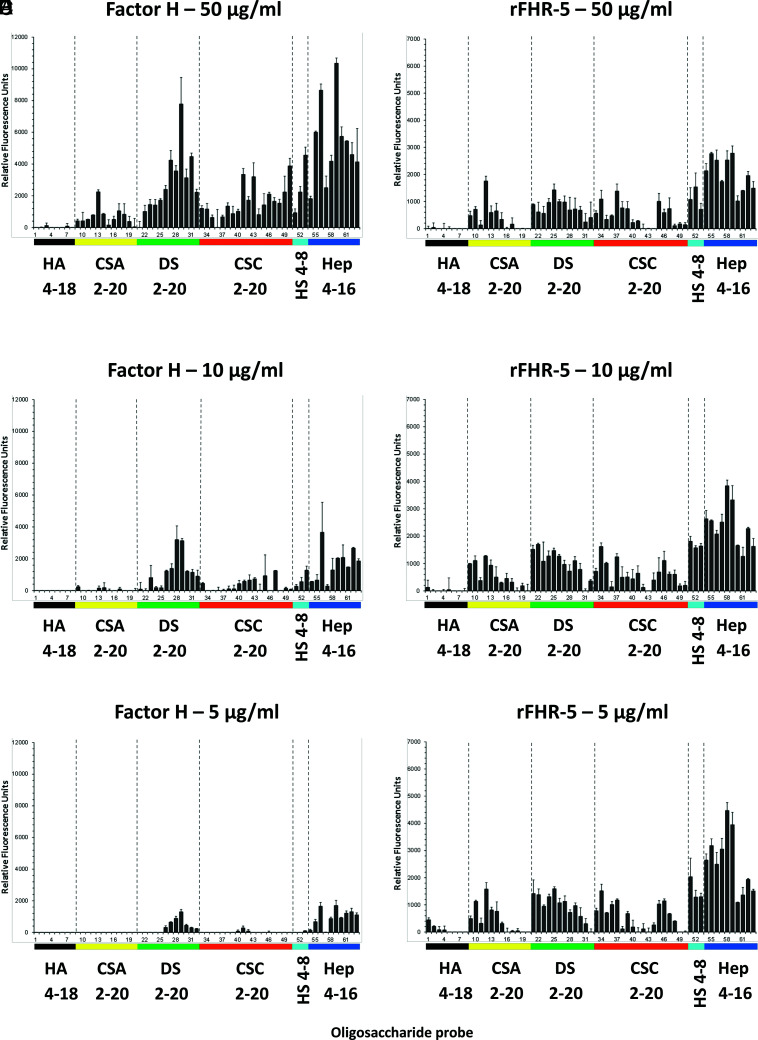
FIGURE 2.
Binding of FH and rFHR-5 to GAG oligosaccharide microarrays. FH (A–C) or rFHR-5 (D–F) were applied to GAG oligosaccharide microarrays at concentrations of 50, 10, and 5 µg of protein per milliliter. Results with increasing oligosaccharide chain lengths are shown from left to right. Sequences of the GAG NGL probes (numbered 1–63 and listed in Table I) are in Supplemental Table II. Binding signals (fluorescence intensities) represent means of duplicates at 5 fmol per spot of each oligosaccharide probe. Error bars represent half of the difference between two values. Binding data shown are representative of at least two independent experiments. Hep, heparin.

