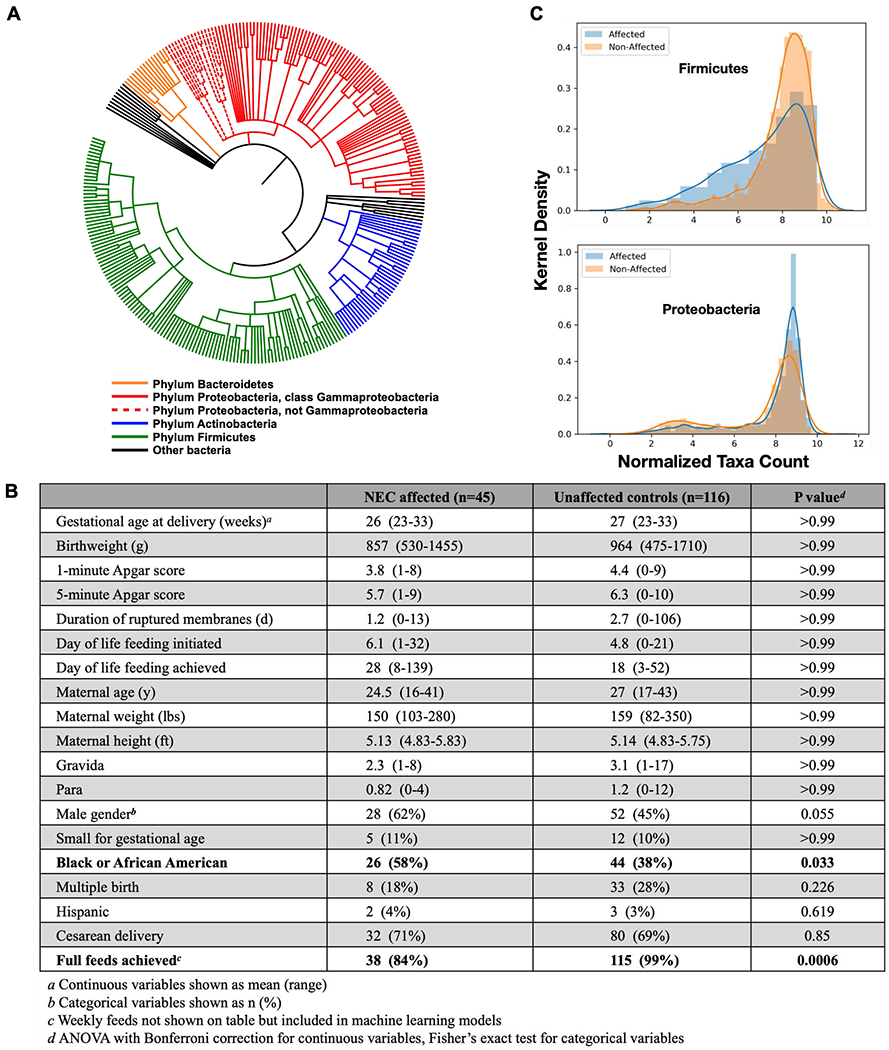
Figure 3:

A phylogenetic tree (A) showing microbiome community members identified through 16S sequencing of DNA from study subject stools. This tree reflects Kraken2 sequence mapping followed by hierarchical feature selection. The table (B) lists clinical metadata features included in our model and statistical comparisons. We confirmed two microbiome trends reported in the initial study: NEC-affected infant microbiota contain less Firmicutes bacteria and more Proteobacteria relative to unaffected control infant microbiota (C).
