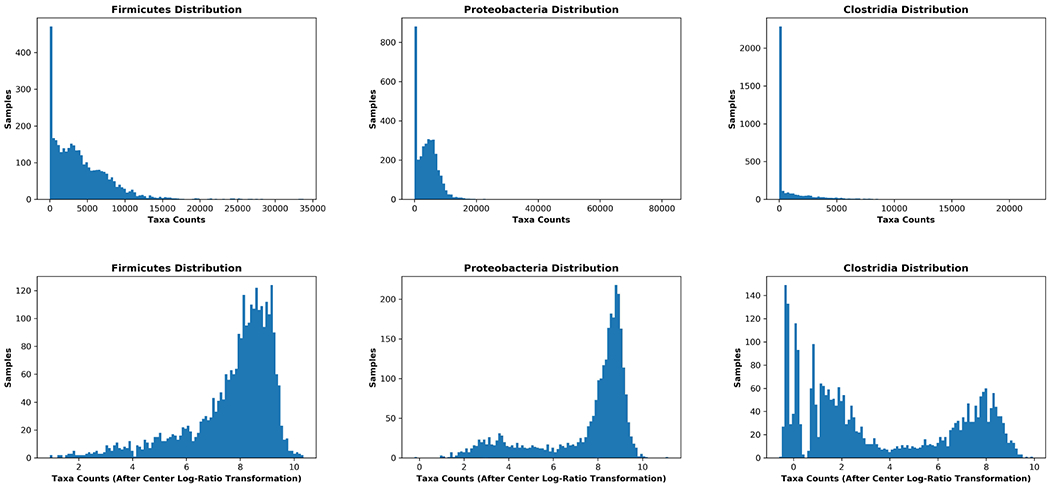
Figure 4:

Pre-processing of microbiome data allows population characteristics to emerge, enabling downstream analyses. The top row shows raw-count taxonomic population data prior to pre-processing. The curves are skewed and compressed. The bottom row shows the same populations after pre-processing as described in the text. Following pre-processing, population distributions are normalized, less skewed, and demonstrate patterns that were obscured in the unprocessed raw data.
