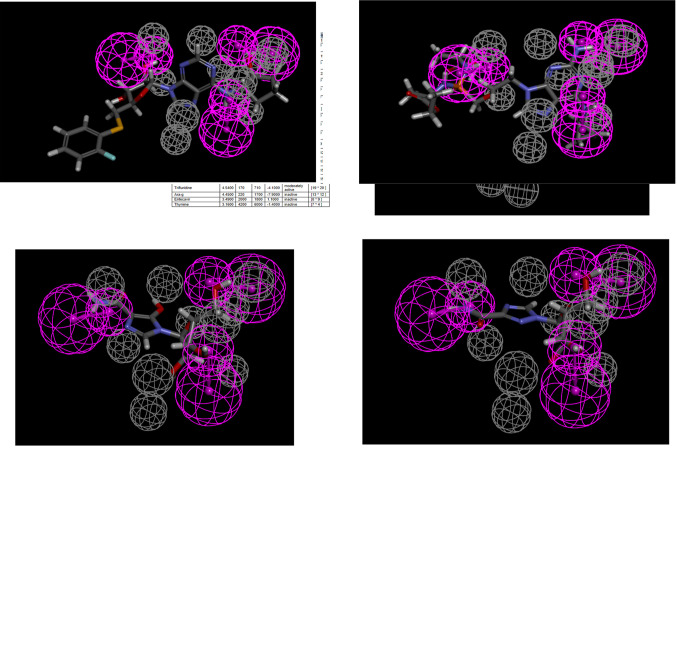
Fig. 1.
ENT1substrate pharmacophore correlation and fit (A) and mapping of gemcitabine (B), mizoribine (C), ribavirin (D), GS-9667 (E), and rabacfosfadine (F) to this pharmacophore. Purple features represent hydrogen bond donors, whereas gray features represent excluded volumes. Act, activity; Est, estimate; Err, error; HBD, hydrogen bond donor.

