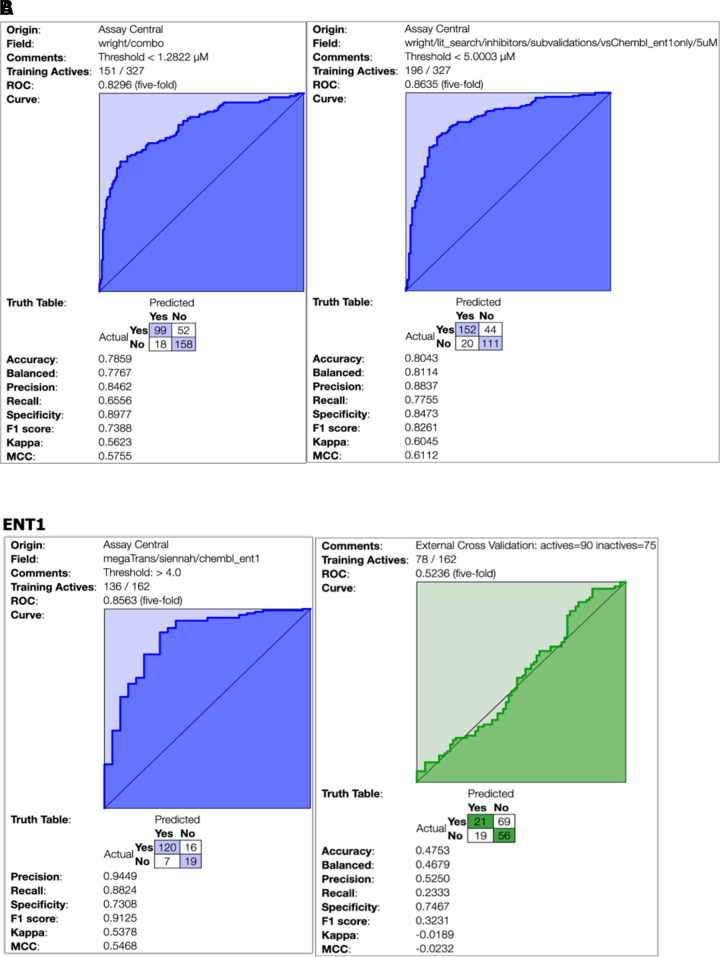
Fig. 6.
(A) Updatedmodel that integrates the original models generated from ChEMBL data from (Miller et al., 2021) with the literature data curated in this study. The model on the left has an automatically calculated threshold of 1.28 µM, whereas the model on the right has a manually selected threshold of 5 µM. (B) ChEMBL training set for ENT1 in purple on the left. Calculated threshold of 1.9 µM to analyze literature inhibitor data in green on the right. MCC, Matthews correlation coefficient; ROC, receiver operating characteristic.

