Figure 3.

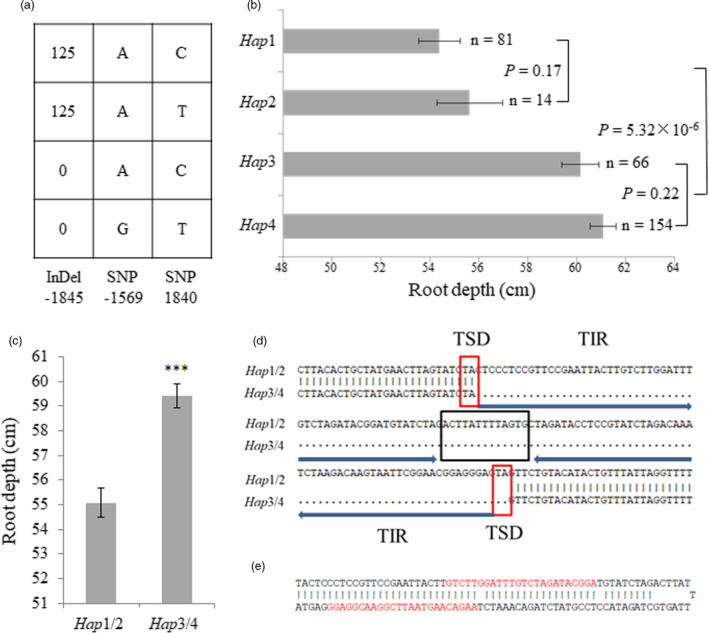
Haplotypes of TaVSR1‐B and root depth phenotypes at the booting stage for the entire test panel. (a) Four TaVSR1‐B haplotypes were identified. When a series of consecutive variants were in complete LD, only one is shown. (b) Root depth phenotypes of different haplotypes. n denotes the number of genotypes per haplotype. Statistical significance was determined by a two‐sided t‐test. (c) Root depth difference between Hap1/2 and Hap3/4. Error bars, ± SE. Statistical significance was determined by a two‐sided t‐test, *** P < 0.001. (d) DNA sequence difference between Hap1/2 and Hap3/4 caused by a 125 bp MITE inserted in the TaVSR1‐B promoter region. Target site duplications (TSDs) are indicated by red boxes. The loop is indicated by a black box. Two terminal inverted repeats (TIRs) are indicated by arrows. (e) Predicted hairpin structure of the MITE consisting of two 57 bp stems and a 13 bp loop. Two 24‐nt small RNA sequences found in the IWGSC Small RNA Database matching the MITE are highlighted in red.
