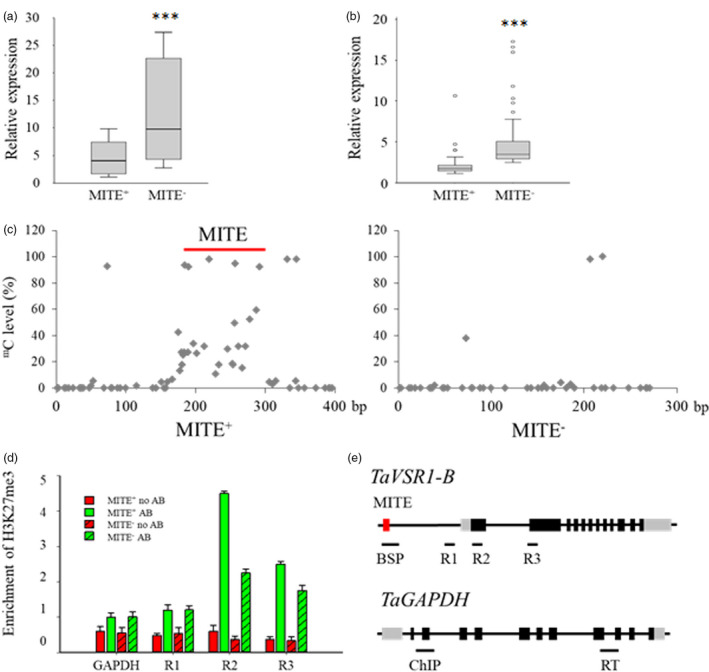
Figure 4.

Comparisons of TaVSR1‐B expression, DNA methylation and H3K27me3 status between MITE+ and MITE− haplotypes of wheat. (a) TaVSR1‐B expression in roots of MITE+ and MITE− haplotypes at the booting stage. Ten accessions of each of MITE+ and MITE− haplotypes were assayed. Error bars, ± SE. Statistical significance was determined by a two‐sided t‐test, ***P < 0.001. (b) TaVSR1‐B expression in MITE+ and MITE− haplotypes in roots of seedlings of all 323 accessions in the test panel. In box plots, centre values are medians, lines indicate variability outside the upper and lower quartiles, and circles denote outliers. Error bars, ± SE. Statistical significance was determined by a two‐sided t‐test, ***P < 0.001. (c) Average DNA methylation status determined by bisulphite sequencing. The 20 accessions used for determining the expression of TaVSR1‐B haplotypes were used. The MITE region is indicated by a red line. (d) H3K27me3 methylation status detected by ChIP–qPCR assays. The same 20 accessions were used. The H3K27me3 status of the TaGAPDH was detected in parallel as a negative control. Anti‐H3 was used as an internal reference in the ChIP–qPCR assay. AB indicates with antibody; no AB indicates without antibody. Error bars, ± SE. (e) Position for detecting epigenetic status. The 125 bp MITE insertion is illustrated by the red box, 5'‐ and 3'‐UTR regions by grey boxes and exons by black boxes. The positions of bisulphite sequencing (BSP), ChIP‐qPCR (R1‐R3) in the genomic region of TaVSR1‐B and ChIP‐qPCR (ChIP), real‐time (RT) in the TaGAPDH are indicated by black lines selected based on H3K27me3 of Chinese Spring (Figure S9).
