Figure 5.

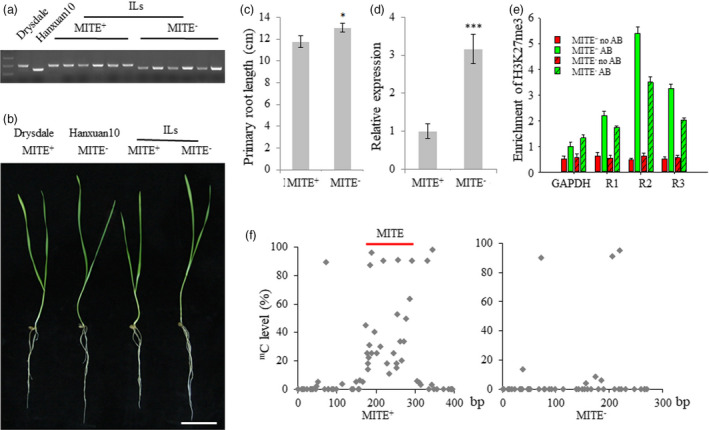
Effect of the MITE insertion in TaVSR1‐B on roots in an IL population. (a) Representative comparison of genotyping based on the 125 bp MITE insertion in the parents and IL population. The DNA band from MITE+ genotypes was 517 bp; and the band from MITE− genotypes was 392 bp. (b) Phenotypes of two‐week‐old seedlings of two TaVSR1‐B haplotypes in the ILs. Bar, 5 cm. (c) Average primary root lengths of two TaVSR1‐B haplotypes in the ILs. Error bars, ± SE. Statistical significance was determined by a two‐sided t‐test, *P < 0.05. (d) Average relative expression in roots of two TaVSR1‐B haplotypes. Error bars, ± SE. Statistical significance was determined by a two‐sided t‐test, ***P < 0.001. (e) Average H3K27me3 methylation status detected by anti‐H3K27me3 ChIP–qPCR assays. The six homozygous MITE+ accessions and randomly selected six homozygous of MITE− accessions were used. Error bars, ± SE. (f) Average DNA methylation status determined by bisulphite sequencing. The same 12 accessions were used in this experiment.
