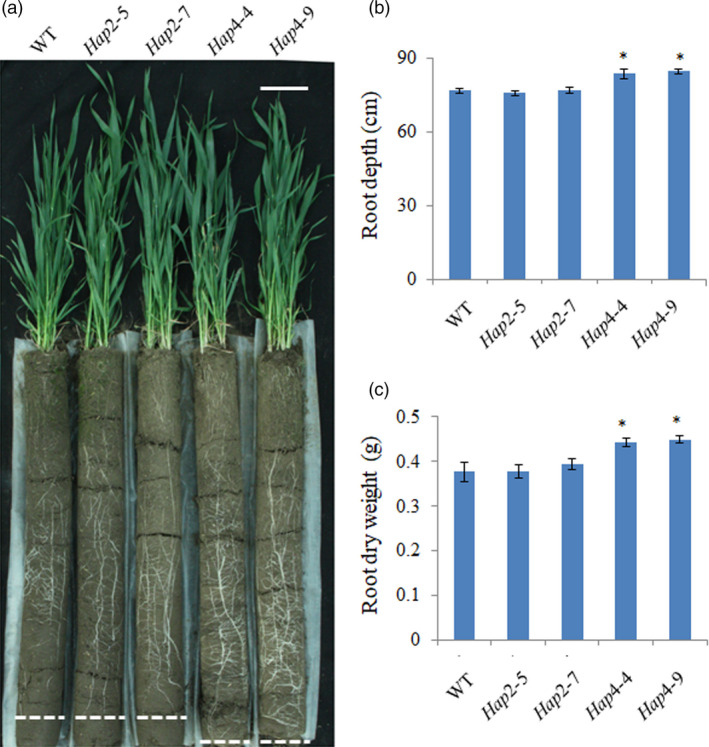
Figure 6.

Seedling phenotypes of two transgenic TaVSR1‐B haplotype wheat lines. Seedlings (a), root depth (b), and root dry weight (c) of transgenic Hap2 (MITE+) and Hap4 (MITE−) lines. Data were based on three biological replications, nine seedlings per line per replicate. Bar, 10 cm. Error bars, ± SE. Statistical significance was determined by a two‐sided t‐test, * P < 0.05.
