
Figure 1.
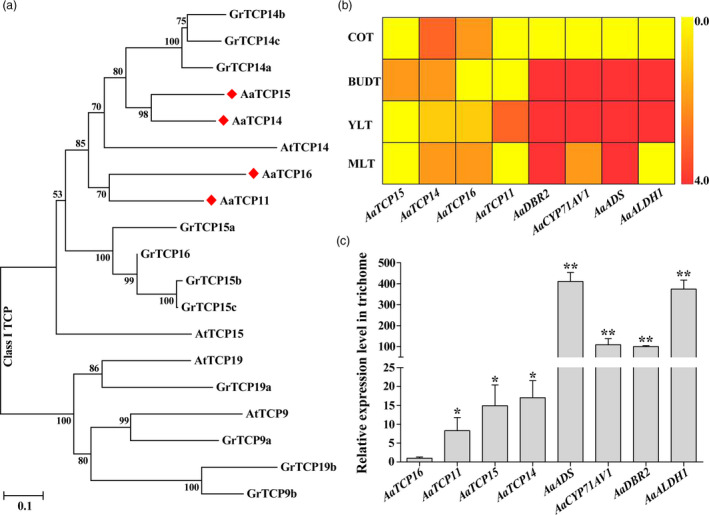
Identification of AaTCP15. (a) Phylogenetic tree showing the relationships of class I TCP transcription factors in Artemisia annua, Arabidopsis thaliana and Gossypium raimondii. TCP sequences were aligned with Clustal W, and a neighbour‐joining phylogenetic tree was constructed using MEGA. Bootstrap values are based on 2000 replicates. AaTCP14, AaTCP11, AaTCP15 and AaTCP16 are marked with red diamonds. The amino acid sequences are named based on the species name. (b) The heat map of transcriptome data includes indicated genes with differential expression in cotyledon (COT), flower bud trichomes (BUDT), young leaf trichomes (YLT) and mature leaf trichomes (MLT) of Artemisia annua. The colour scale at the right represents the value of transformed reads per kilobase per million mapped reads. (c) Relative expression levels of AaTCP16, AaTCP11, AaTCP15, AaTCP14, AaADS, AaCYP71AV1, AaDBR2 and AaALDH1 in trichomes were measured by quantitative real‐time PCR (qRT‐PCR). The expression level of AaTCP16 was set as 1. AaActin was used as an internal control. The data represent the means ± SD of three replicates from three independent A. annua plants. *P < 0.05, **P < 0.01, Student’s t‐test.