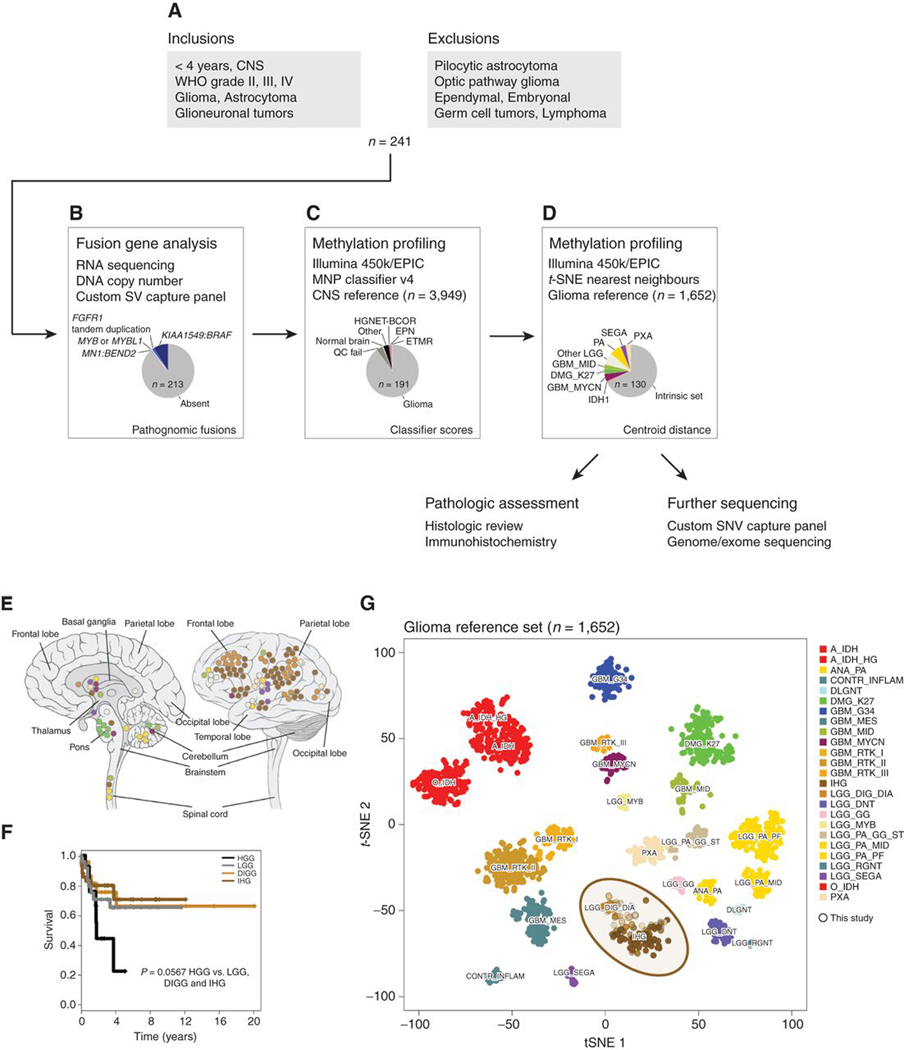
Figure 1.
Defining an intrinsic set of infant gliomas. A, Flow diagram providing an overview of the inclusion and exclusion criteria for the assembled cohort of 241 samples from patients younger than 4 years. B, Fusion gene analysis by a variety of means allowed for the identification of 28 fusions marking clearly defined entities that were subsequently excluded from further analysis. C, Methylation array profiling and analysis by the Heidelberg classifier excluded a further 12 cases closely resembling non-glioma entities or failing quality control (n = 9). D, t-statistic based stochastic neighbor embedding (t-SNE) projection of the remaining cases highlighted 61 samples which clustered with previously reported high or low grade glioma subtypes, leaving an intrinsic set of 130 infant gliomas for further characterization by more histopathological assessment and in-depth sequencing. E, Anatomic location of infant gliomas after exclusion of pathognomonic fusions and non-glioma entities by methylation profiling (n = 130). Left, sagittal section showing internal structures; right, external view highlighting cerebral lobes. Each circle represents a single case and is colored by the glioma subgroup it most closely clusters with, defined by the key below. F, Kaplan–Meier plot of overall survival of cases separated by methylation subgroups DIGG (desmoplastic infantile ganglioglioma/astrocytoma), IHG (infantile hemispheric glioma), LGG (other low-grade glioma subgroups), and HGG (other high-grade glioma subgroups; n = 102). P value is calculated by the log-rank test (P = 0.0566 for HGG vs. rest). G, t-statistic based t-SNE projection of a combined methylation dataset comprising the intrinsic set of the current study (n = 130, circled) plus a reference set of glioma subtypes (n = 1,652). The first two projections are plotted on the x and y axes, with samples represented by dots colored by subtype according to the key provided.

